
Plotting Smarter Stock Entries & Exits with K-Reversal in Python
Implementation of the Simple, Yet Powerful K-Reversal Indicator

1. Introduction
Amid the vast arsenal of tools and techniques stands the K-Reversal Indicator — an unassuming, yet remarkably effective instrument. In this article, we not only demystify its mechanics but also showcase its practical implementation, enabling you to enhance your trading arsenal.
2. The K-Reversal Indicator
2.1 Origins and Development
Historically, market behavior has always been a blend of quantifiable data and human sentiment. The oscillation between optimism and caution has invariably been a driving force behind price movements. The K-Reversal Indicator was borne out of the need to quantify these shifts in sentiment. Its genesis can be traced back to seasoned traders’ intuitive observations, which, over time, have been refined and formalized into the tool we recognize today.
2.2 K-Reversal Mathematics
At the heart of the K-Reversal lies a straightforward yet profound formula. It calculates the relative position of the current closing price concerning its high and low over a predetermined period. Represented mathematically:

Where:
- Close is the current closing price.
- LowN is the lowest price over the last N days.
- HighN is the highest price over the last N days.
By tracking the K value, traders can discern potential reversals in stock trends. When K values are extremely low, it might suggest a potential uptrend, whereas exceedingly high values could hint at a downtrend.
3. Python Implementation
3.1 Libraries and Data Retrieval
For the purpose of stock price analysis, libraries such as pandas for data manipulation and matplotlib for data visualization are instrumental. We can further leverage libraries such as pandas_datareader or platforms like Yahoo Finance to retrieve historical stock data seamlessly.
The process involves specifying the stock ticker, and the desired time frame, and the library handles the rest, returning the data in a structured format, ready for analysis. To acquire stock data, the yf.download() method is leveraged:
ticker = "ASML.AS"
df = yf.download(ticker, start="2020-01-01", end="2023-12-26")
df['Date'] = df.index
3.2 The K-Reversal Calculation
Using pandas, the K-Reversal indicator calculation can easily be performed as follows:
def calculate_k_reversal(df, n=14):
    highs = df['High'].rolling(n).max()
    lows = df['Low'].rolling(n).min()
    k_values = 100 * (df['Close'] - lows) / (highs - lows)
    return k_values
k_values = calculate_k_reversal(df)
3.3 Signal Identification
Upon having the K-Reversal values, it’s imperative to identify the buy and sell signals:
buy_signals_k = k_values[k_values < 20]
sell_signals_k = k_values[k_values > 80]
buy_signals_price = df[df['Close'] < df['Close'].rolling(20).min()]['Close']
sell_signals_price = df[df['Close'] > df['Close'].rolling(20).max()]['Close']
Keep in mind that the thresholds for K-Reversal to pinpoint buy and sell signals are customizable. You have the flexibility to fine-tune or backtest these values, optimizing them to minimize false positives and enhance accuracy.
3.4 Visualizing with Python
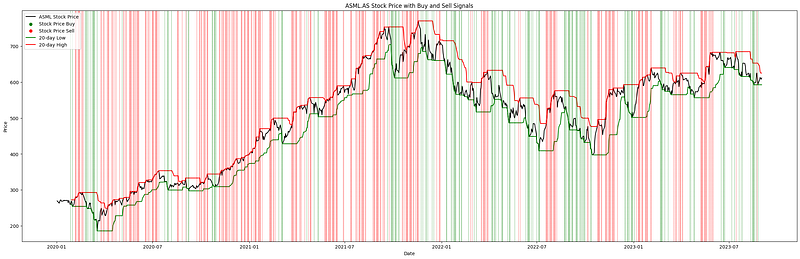
Using the matplotlib library, we can create intuitive visualizations for our analysis. For instance, the stock price with buy and sell signals is depicted as:
fig, ax = plt.subplots(figsize=(30, 5))
ax.plot(df['Date'], df['Close'], color='black', label='ASML Stock Price')
...
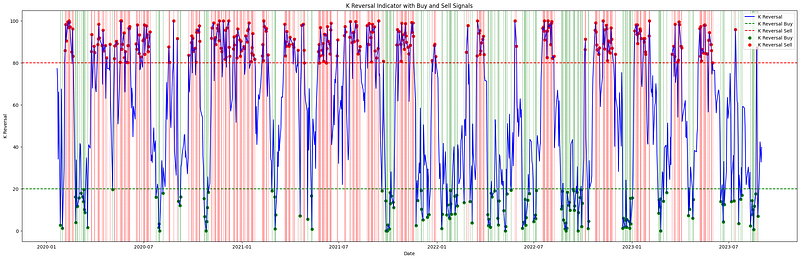
plt.show()And the K-Reversal indicator visualization is represented by:
fig, ax = plt.subplots(figsize=(30,5))
ax.plot(df['Date'], k_values, color='blue', label='K Reversal')
...
plt.show()
3.5 Complete Code
While the sections above detail individual steps of the analysis, integrating them provides an end-to-end solution for stock price evaluation:
import pandas as pd
import numpy as np
import matplotlib.pyplot as plt

ticker = "ASML.AS"
df = yf.download(ticker, start="2020-01-01", end="2023-12-26")

df['Date'] = df.index


# Define a function to calculate the K reversal
def calculate_k_reversal(df, n=14):
    highs = df['High'].rolling(n).max()
    lows = df['Low'].rolling(n).min()
    k_values = 100 * (df['Close'] - lows) / (highs - lows)
    return k_values

# Calculate the K reversal and the buy and sell signals for the K reversal
# Buy and sell thresholds can be adjusted for fewer false positives
k_values = calculate_k_reversal(df)
buy_signals_k = k_values[k_values < 20]
sell_signals_k = k_values[k_values > 80]

# Calculate the buy and sell signals for the stock price
buy_signals_price = df[df['Close'] < df['Close'].rolling(20).min()]['Close']
sell_signals_price = df[df['Close'] > df['Close'].rolling(20).max()]['Close']

# Create a plot for the ASML stock price with buy and sell signals
fig, ax = plt.subplots(figsize=(30, 9))

ax.plot(df['Date'], df['Close'], color='black', label='ASML Stock Price')
ax.scatter(buy_signals_price.index, buy_signals_price.values, color='green', label='Stock Price Buy')
ax.scatter(sell_signals_price.index, sell_signals_price.values, color='red', label='Stock Price Sell')
ax.plot(df['Date'], df['Close'].rolling(20).min(), color='green', label='20-day Low')
ax.plot(df['Date'], df['Close'].rolling(20).max(), color='red', label='20-day High')

# Draw vertical lines based on the K reversal buy/sell signals
for date in buy_signals_k.index:
    ax.axvline(date, color='g', alpha=1, linestyle='--', linewidth=0.5)
for date in sell_signals_k.index:
    ax.axvline(date, color='r', alpha=1, linestyle='--', linewidth=0.5)

ax.legend(loc='upper left')
ax.set(title=f'{ticker} Stock Price with Buy and Sell Signals', xlabel='Date', ylabel='Price')

plt.show()

# Create a plot for the K reversal indicator with buy and sell signals
fig, ax = plt.subplots(figsize=(30,9))

ax.plot(df['Date'], k_values, color='blue', label='K Reversal')
ax.axhline(y=20, color='green', linestyle='--', label='K Reversal Buy')
ax.axhline(y=80, color='red', linestyle='--', label='K Reversal Sell')
ax.scatter(buy_signals_k.index, buy_signals_k.values, color='green', label='K Reversal Buy')
ax.scatter(sell_signals_k.index, sell_signals_k.values, color='red', label='K Reversal Sell')

for date in buy_signals_k.index:
    ax.axvline(date, color='g', alpha=1, linestyle='--', linewidth=0.5)
for date in sell_signals_k.index:
    ax.axvline(date, color='r', alpha=1, linestyle='--', linewidth=0.5)

ax.legend()
ax.set(title='K Reversal Indicator with Buy and Sell Signals', xlabel='Date', ylabel='K Reversal')

plt.show()
4. Practical Implications
4.1 When and How to Use it
The K-Reversal indicator, like many technical indicators, is particularly beneficial when used in tandem with other technical analysis tools. It’s crucial to remember that no single indicator can provide all the answers. Here’s when and how you can make the most of the K-Reversal:
- Trending Markets: The K-Reversal shines in markets that are exhibiting clear trends. When there’s a discernible upward or downward momentum, this indicator can provide valuable buy or sell cues.
- Conjunction with Other Indicators: Pair the K-Reversal with other momentum or trend indicators. For instance, a moving average can help validate a buy or sell signal provided by the K-Reversal.
- Adjustment and Refinement: As highlighted earlier, you’re encouraged to fine-tune the K-Reversal’s thresholds based on the stock or market you’re analyzing. Markets can have different volatilities, and what works for one might not work for another.
# Sample snippet of K-Reversal in conjunction with a simple moving average
sma = df['Close'].rolling(window=20).mean()
ax.plot(df['Date'], sma, color='orange', label='20-day Simple Moving Average')
4.2 Benefits and Pitfalls
Benefits:
- Flexibility: The K-Reversal is customizable, allowing traders to adjust it based on the characteristics of the particular stock or market.
- Clear Indications: By visualizing the K-Reversal on a chart, traders can quickly ascertain potential buy and sell zones.
Pitfalls:
- False Signals: Like all technical indicators, K-Reversal can produce false signals, especially in markets with high volatility or during major news events.
- Not a Standalone Tool: Solely relying on K-Reversal without considering other factors or indicators might lead to suboptimal trading decisions.
For the budding data scientists and traders out there, dive into the code, modify it, and experiment with different parameters. Your trading strategy could benefit immensely from a fresh perspective or a minor tweak!
5. Conclusion
In the modern trading arena, the K-Reversal indicator holds significant importance, offering insights into potential market entry and exit points. While it is a potent tool, always remember to use it judiciously and in combination with other indicators to increase its efficacy. Your feedback, discussions, and suggestions about the K-Reversal, its improvements, or any other trading strategies are highly valued.
In Plain English
Thank you for being a part of our community! Before you go:
- Be sure to clap and follow the writer! 👏
- You can find even more content at PlainEnglish.io 🚀
- Sign up for our free weekly newsletter. 🗞️
- Follow us on Twitter(X), LinkedIn, YouTube, and Discord.


