
Performing Exploratory Data Analysis (EDA) using Pivot Tables in Pandas
Learn how to use the pivot_table() function in Pandas to aggregate your data

Most excel users are very familiar with the concept of a pivot table. A pivot table is a table of grouped values that aggregates all the individual items of a much bigger table. A pivot table provides a summary of discrete categories, such as sum, averages, as well as various statistics of interests. A pivot table serves as a very useful tool for you to explore and analyze your data, and makes it easy for you to perform comparisons and view trends.
In this article, I will walk you through pivot tables in Pandas and how you can make use of it to perform EDA.
Example 1 — Analyzing World Population Data
For the first part, I shall make use of the world population dataset to answer some of the questions pertaining to world population.
Source of Data: The data source for this part is from https://github.com/resbaz/r-novice-gapminder-files/blob/master/data/gapminder-FiveYearData.csv.
Important Note from the website (https://github.com/resbaz/r-novice-gapminder-files): “This dataset is not endorsed by the people at Gapminder. In particular, we removed relatively incomplete portions of the original data to make it cleaner for our pedagogical purposes. If you require the unfiltered data you should obtain it from Gapminder. Also note that this repository is not currently actively maintained. However, if you would like to improve upon the data herein, we will view serious pull requests favourably.”
Loading the data
Let’s load the data into a Pandas DataFrame:
import pandas as pddata_url = 'https://raw.githubusercontent.com/resbaz/r-novice-gapminder-files/master/data/gapminder-FiveYearData.csv'
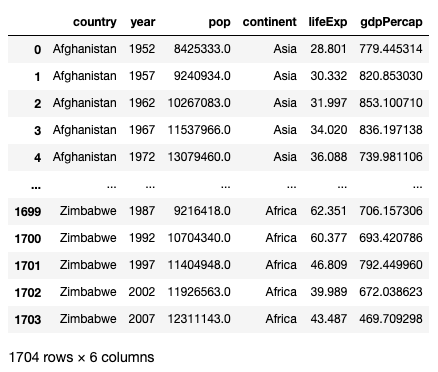
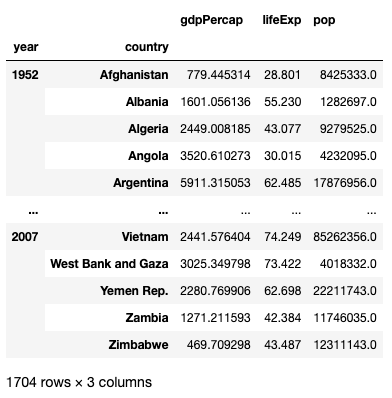
df = pd.read_csv(data_url)dfThe dataframe contains various data of countries spread across five continents — Africa, Americas, Asia, Europe and Oceania. It contains data on population, life expectancy, and GDP per capita, from 1952 to 2007:
Finding the mean values for each country
To start off, let’s find the mean of the various statistics for each country using the pivot_table() function:
pd.pivot_table(
df,
index='country',
aggfunc='mean'
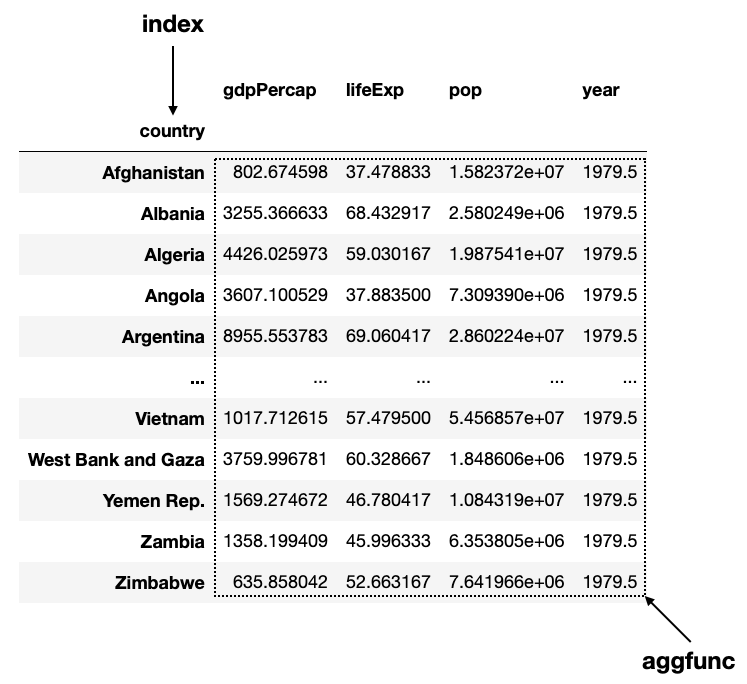
)The index parameter specifies the index to use for the result of the function. The aggfunc parameter specifies the function to apply on the numeric columns of the dataframe. The following figure shows the result and how the various parameters dictate the outcome:
If you are already familiar with the
groupby()function in Pandas, you can think of thepivot_table()function as equal togroupby()+agg()+unstack().
The default aggfunc value is mean (a Pandas function) if you do not specify its value. You can also supply a NumPy function such as np.mean, or any function that returns an aggregated value (you will see this in a later section of this article):
import numpy as nppd.pivot_table(
df,
index='country',
aggfunc=np.mean
)Finding the mean GDP and mean, max, and min of life expectancies
From the previous result you see that it does not really make sense to calculate the mean of the year column. Also, you might want to know the minimum, maximum, and average life expectancies of each country. To do so, you can specify a dictionary for the aggfunc parameter and indicate what function to apply to which column:
import numpy as nppd.pivot_table(
df,
index='country',
aggfunc={
'gdpPercap':np.mean,
'lifeExp':[np.mean,np.max,np.min]
}
)The above code snippet produces the following output:
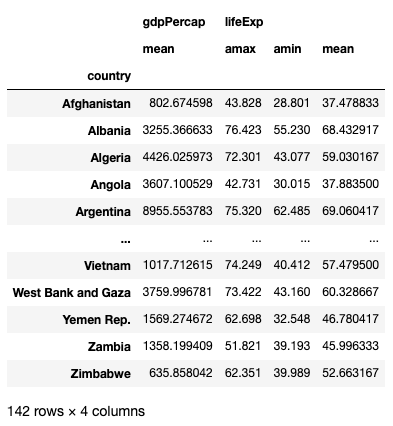
Observe that since we did not specify the pop and year columns in the dictionary, they will no longer appear in the result.
Finding the mean values of each countries for each year
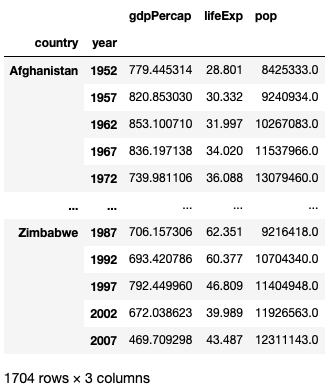
The index parameters also accepts a list of columns that will result in a multi-index dataframe result. For example, I want to know the mean GDP, life expectancies, and population of each county for each year from 1952 to 2007. I can do it like this:
pd.pivot_table(
    df,
    index=['country','year'],
    aggfunc='mean'
)
The result is a multi-index dataframe with country and year as the index, and the rest of the numeric fields as columns :
Finding the mean values of each year for each country
How about we group the result based on year, followed by country? Simple, in this change the order of the list items in the index parameter:
pd.pivot_table(
    df,
    index=['year','country'],
    aggfunc='mean'
)
The result now is grouped by year:
Finding the mean values for each continent
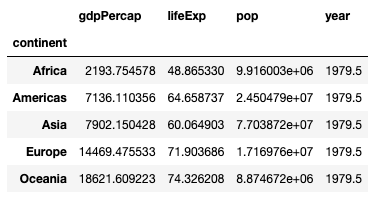
If you want to find the mean values for each continent, simply set the index parameter to continent:
pd.pivot_table(
    df,
    index='continent'
)
You will now see the following result:
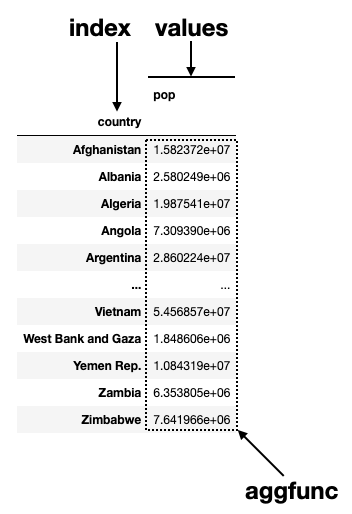
Finding the population of each country
If you want to know the mean population for each country from 1952 to 2007, set the index to country and values to pop:
pd.pivot_table(
    df,
    index='country',
    values='pop',
    aggfunc='mean'
)
The following shows the use of the values parameter:
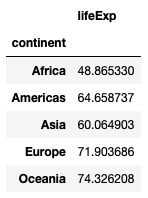
Finding the mean life expectancies for each continent
To find the mean life expectancies for each continent, set the index and values parameters as follows:
pd.pivot_table(
    df,
    index='continent',
    values='lifeExp',
    aggfunc='mean'
)
You will see the result as follows:
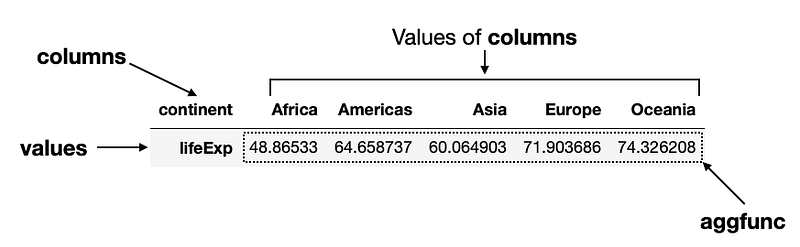
What if you want to flip the columns and rows of the result? Easy, change the index parameter to columns:
pd.pivot_table(
    df,
    columns='continent',
    values='lifeExp',
    aggfunc='mean'
)
The following figure shows the result and the use of the various parameters:
Finding the life expectancies of each country in the various continents
Next, we want to know the life expectancies of each country in each of the five continents. We could do this:
pd.pivot_table(
    df,
    index='country',
    columns='continent',
    values='lifeExp',
    aggfunc='mean'
)
Now the life expectancies of each country will be displayed in the respective continent that the country belongs to:
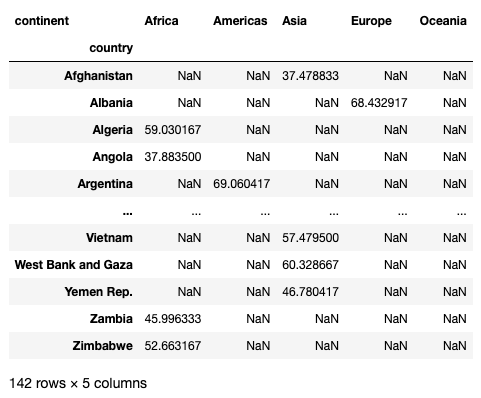
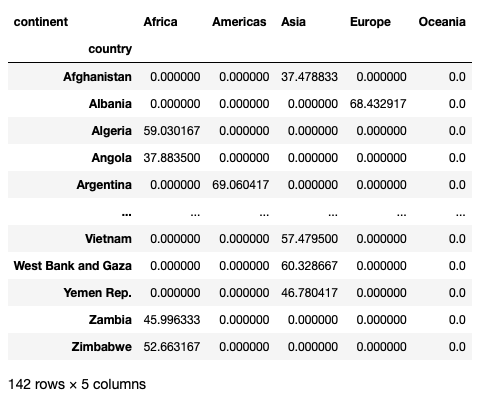
Notice the NaNs scattered in the result. If you do not want to see the NaNs, you can set the fill_value parameter to fill them with some values, such as 0s:
pd.pivot_table(
    df,
    index='country',
    columns='continent',
    values='lifeExp',
    aggfunc='mean',
    fill_value=0
)
You should now see 0s instead of NaNs:
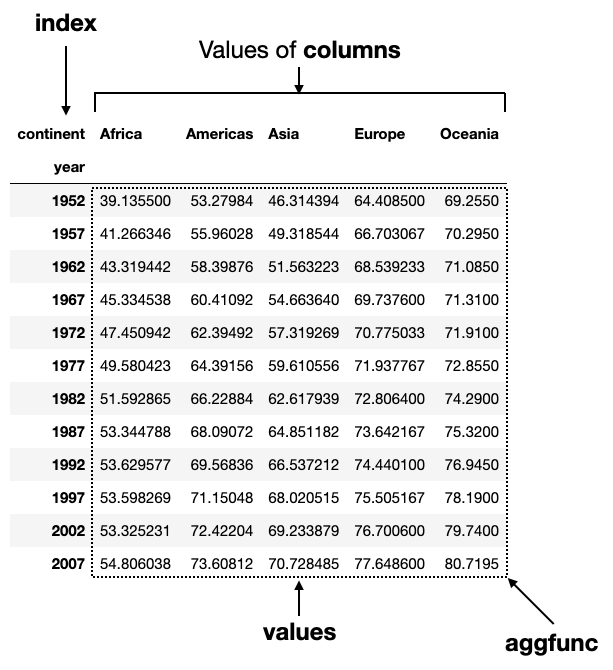
Finding the mean life expectancies of each continent by year
Finally, let’s find the mean life expectancies of each continent and group them by year:
pd.pivot_table(
    df,
    index='year',
    columns='continent',
    values='lifeExp',
    aggfunc='mean'
)
The figure below shows the result and the use of the various parameters:
Example 2 — Analyzing Titanic Data
The next dataset that I am going to use is the classic Titanic Dataset.
Source of Data: The data source for this part is from https://www.kaggle.com/datasets/tedllh/titanic-train.
Licensing — Database Contents License (DbCL) v1.0 https://opendatacommons.org/licenses/dbcl/1-0/
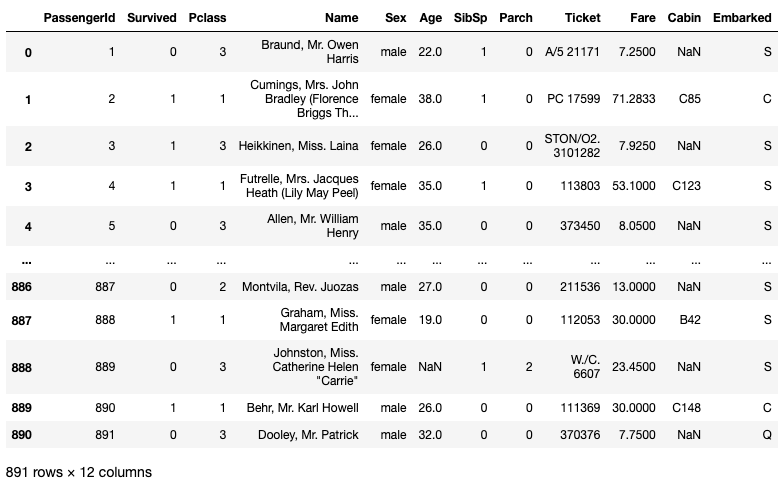
Let’s load the CSV file into a Pandas DataFrame:
import pandas as pd
df = pd.read_csv('titanic_train.csv')
df
The dataframe has 891 rows and 12 columns:
Finding the mean values for each gender
First, we are interested to see the various mean values for each gender:
pd.pivot_table(
    df,
    index='Sex'
)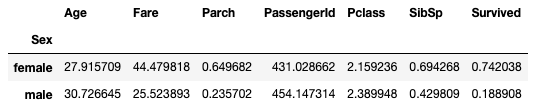
For some of the columns, it does not make sense to see their aggregated values, for example — PassengerId, and Pclass. So let’s modify the aggfunc parameter so that I can get the following information:
- Get the mean Age
- Get the distribution of Pclass
- Get the mode (the most frequent occurrence) of Survived
You can do this using the following code snippet:
from scipy import statspd.pivot_table(
df,
index='Sex',
aggfunc={
'Age': 'mean',
'Pclass':lambda x: dict(x.value_counts()),
'Survived':scipy.stats.mode
}
)For the aggfunc argument, the value for each key must be a function that returns an aggregated result. So far all the functions that we have used are straight-forward — mean and sum (you can also use functions like min and max). If you want something more complicated you need to write your own function. For the Pclass column, I will write a lambda function to get the value counts of the Series passed to it and then convert it to a dictionary. For the Survived column I will make use of the mode function in the scipy module.
The result looks like this:
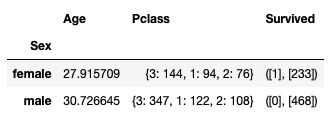
You can see from the result above:
- Majority of the female passengers survived while majority of the male passengers died
- Most male and female passengers were in third class cabins
- The mean age for female passengers is younger than that for males
Finding the distribution of genders from different port of embarkation
Next, we would also like to know how the distribution of genders is related to the port of embarkation:
df_sex_embarked = pd.pivot_table(
    df,
    index='Sex',
    columns='Embarked',
    values='Survived',
    aggfunc='count'
)
df_sex_embarked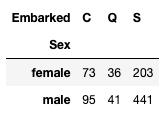
From the result, you can see that most people boarded the ship at Southampton (‘S’), regardless of gender.
Finding the distribution of for survivors for each genders from different port of embarkation
We would also like to know how each gender’s survivor numbers relate to the port of embarkation. This is simple as you just need to change the aggfunc from count to sum:
df_sex_embarked_survived = pd.pivot_table(
    df,
    index='Sex',
    columns='Embarked',
    values='Survived',
    aggfunc='sum'
)
df_sex_embarked_survived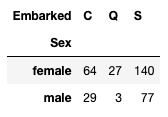
But the result doesn’t really give you much idea as to which port of embarkation has a higher survival rate. Here is a better way is to calculate the survival ratio of each gender at different port of embarkation:
df_sex_embarked_survived / df_sex_embarked * 100The result now shows a much clearer picture:
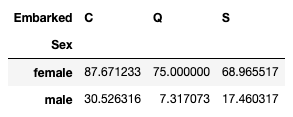
You can now observe that more people who boarded the Titanic at Cherbourg (‘C’) survived.
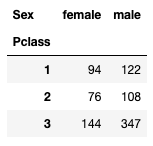
Finding the distribution of genders for each cabin class
We are also curious about the distribution of genders for each cabin class:
df_sex_pclass = pd.pivot_table(
    df,
    index='Pclass',
    columns='Sex',
    values='Survived',
    aggfunc='count'
)
df_sex_pclass
You can see that most passengers are in third class:
And their survival based on classes:
df_sex_pclass_survived = pd.pivot_table(
    df,
    index='Pclass',
    columns='Sex',
    values='Survived',
    aggfunc='sum'
)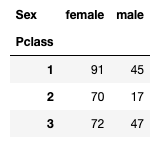
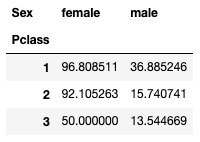
Again, it would be better to calculate their survival ratio:
df_sex_pclass_survived / df_sex_pclass * 100And interestingly (but not surprisingly), passengers who were in first class have a higher survival rate:
Instead of taking the two different dataframes and dividing them, is there an easier way to calculate their survival rate? Of course, if you use a lambda function:
pd.pivot_table(
    df,
    index='Pclass',
    columns='Sex',
    values='Survived',
    aggfunc=lambda x: x.sum() / len(x)
)
In the above statement, x will be passed the values (for the Survived column) for females in class 1 (as a Series), followed by males in class 1, females in class 2, and so on.
Summary
I hope this article managed to shed some lights in the usefulness of the pivot_table() function. Instead of spending time performing groupbys, you can directly call the pivot_table() function and get the aggregated results. And instead of using built-in Pandas or NumPy functions, you can write your own custom functions and use it within the pivot_table() function. Do you have some nice tricks to share? Let me know in the comments!
Level Up Coding
Thanks for being a part of our community! Before you go:
- 👏 Clap for the story and follow the author 👉
- 📰 View more content in the Level Up Coding publication
- 🔔 Follow us: Twitter | LinkedIn | Newsletter
🚀👉 Join the Level Up talent collective and find an amazing job


