
Python Tutorial: Perform Powerful Statistical Analysis 0n Real-World Data With Ease!
Learn how to perform statistical analysis on real-world datasets!

In this tutorial, we will learn how to perform statistical analysis on real-world datasets using Python. We will use the Python package pandas for this tutorial.
pandas is a powerful Python package that provides extensive functionality for data analysis and manipulation. It is built on top of the popular numerical computing library NumPy and features a rich set of functions for working with data.
pandas are particularly well-suited for working with tabular data, such as data from a database or spreadsheet. In this tutorial, we will learn how to use pandas to load, manipulate, and analyze real-world datasets.
We will cover the following topics in this tutorial:
Loading data into pandas
Exploring data with pandas
Cleaning data with pandas
Performing statistical analysis with pandas
Let’s get started!
Loading Data into pandas
Before we can start working with data in pandas, we first need to load it into the package. pandas provide a number of functions for reading data from different sources.
For this tutorial, we will be working with the following dataset:
The dataset contains information on different countries around the world, including their population, GDP, and life expectancy.
In this tutorial, we will use Google Colab to load out the dataset.
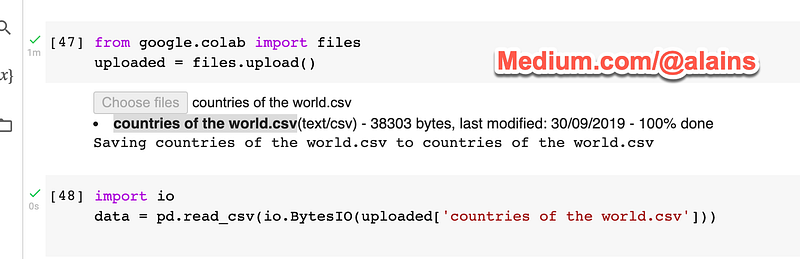
The dataset is available for free here
We can load this dataset into pandas using the read_csv() function:
import iodata = pd.read_csv(io.BytesIO(uploaded['countries of the world.csv']))This code will read the CSV file “countries of the world.csv” and store the data in a pandas DataFrame object called “data”.
A DataFrame is a two-dimensional data structure that contains rows and columns. It is similar to a spreadsheet or a database table.
Once the data is loaded into a DataFrame, we can start manipulating and analyzing it.
Exploring Data with pandas
Once the data is loaded into a DataFrame, we can start exploring it. pandas provide a number of functions for getting information about the data.
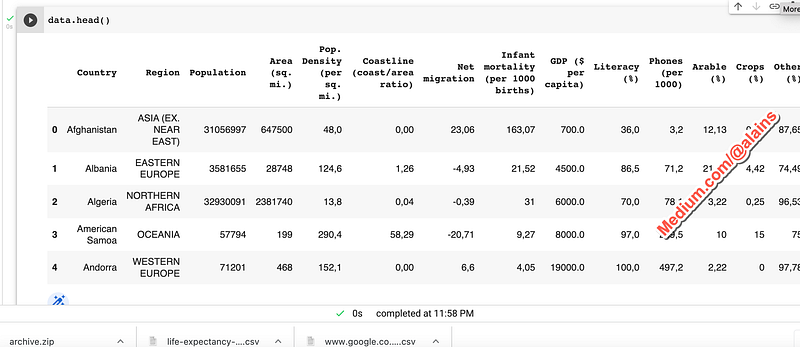
We can start by looking at the first few rows of the data:
data.head()data.head()This code will print the first five rows of the data.
Output
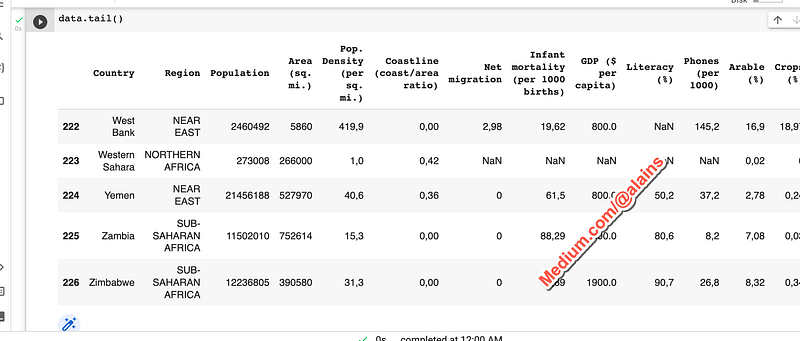
We can also look at the last few rows:
data.tail()This code will print the last five rows of the data.
Output
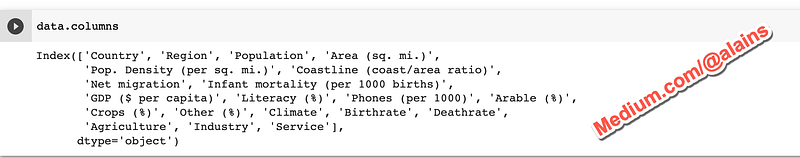
We can also get information about the columns in the data:
data.columnsThis code will print the names of the columns in the data.
Output
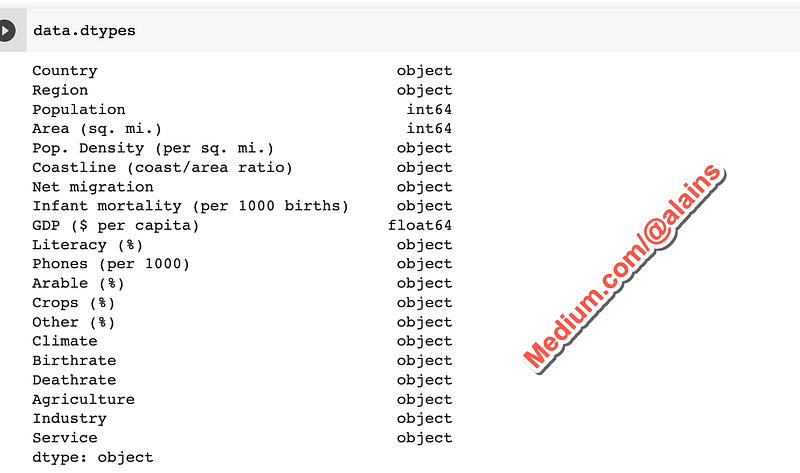
We can also get information about the data types of the columns:
data.dtypesThis code will print the data types of the columns in the data.
Output
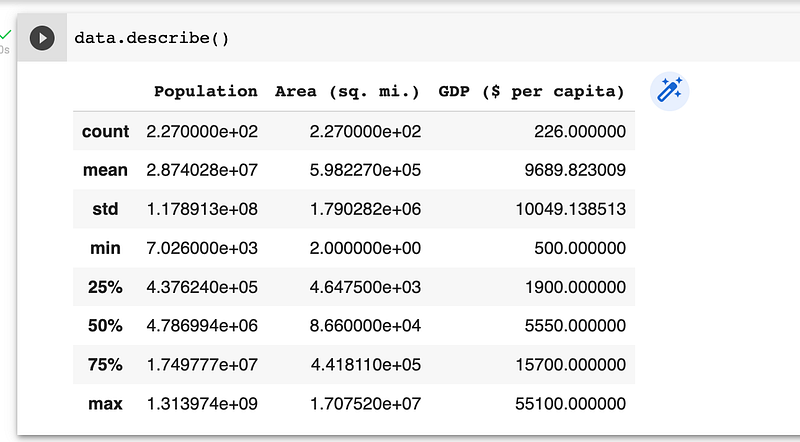
We can also get summary statistics about the data:
data.describe()This code will print a summary of the numerical columns in the data.
Output
These are just a few of the functions that pandas provide for exploring data. For more information on these and other functions, see the pandas documentation.
Cleaning Data with pandas
Once we have explored the data, we may need to clean it before we can start performing statistical analysis.
There are a number of different things that we may need to do to clean the data, such as:
Remove invalid or missing values
Convert data types
Encode categorical variables
pandas provide a number of functions for doing these and other tasks.
For this tutorial, we will focus on two of these functions: dropna() and astype().
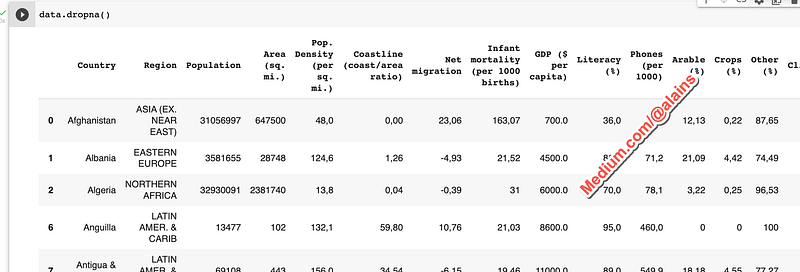
The dropna() function can be used to remove rows or columns that contain missing values:
data.dropna()This code will drop all rows that contain missing values.
Output
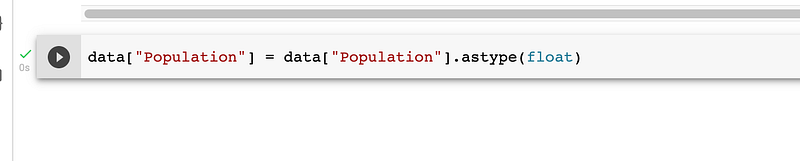
The astype() function can be used to convert data types:
data[“population”] = data[“population”].astype(float)This code will convert the “population” column to a floating point data type.
Output
Once the data is cleaned, we can start performing statistical analysis.
Performing Statistical Analysis with pandas
pandas provides a number of functions for performing statistical analysis.
We will cover two of these functions in this tutorial:
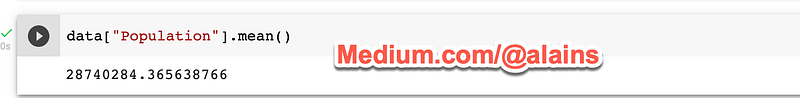
The mean() function can be used to calculate the mean of a column:
data[“population”].mean()This code will calculate the mean of the “population” column.
Output
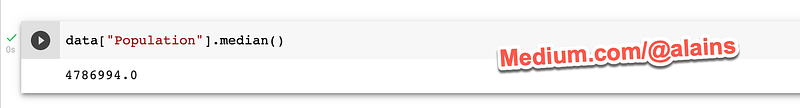
The median() function can be used to calculate the median of a column:
data[“Population”].median()This code will calculate the median of the “Population” column.
Output
These are just a few of the statistical functions that pandas provide. For more information on these and other functions, see the pandas documentation.
In this tutorial, we have learned how to perform statistical analysis on real-world datasets using Python. We have used the pandas package to load, manipulate, and analyze data.
We have also covered how to clean data and how to perform statistical analysis with pandas.
This tutorial is just the beginning. There is a lot more than you can do with pandas. For more information, see the pandas documentation.
Before you leave:
So don’t wait — sign up now and start enjoying all that Medium has to offer.
If you enjoyed this article, please follow me and give me a few claps or maybe if you want to support me, buy me a cup of coffee! I would greatly appreciate it! Thank you in advance.
All of my articles can be found on this page.
Follow me on Twitter if you want even more content on:
- Making Money Online - Passive Income - Digital Assets - Side Hustles - Self-improvement - Personal Development - Relationship - Programming - Data Science - Artificial Intelligence - Fiction