
Partial Autocorrelation for Time Series Analysis
Describing what partial autocorrelation is and its importance in time series analysis
Introduction
In my previous post we discussed the concept of autocorrelation:
Autocorrelation is the correlation of random variables or data against itself at different points in time (lags). Autocorrelation conveys the similarity of the data at different lags enabling us to deduce some interesting features of our time series such as seasonality and trend.
If you want to learn more about autocorrelation, make sure to checkout my post that I linked above!
Most people have heard about autocorrelation, however you may not know of its less popular cousin partial autocorrelation function (PACF). In this short and sweet post I want to describe what PACF is, why it is useful and go through a simple example in applying PACF in Python.
What is Partial Autocorrelation?
We can begin by explaining partial correlation. This is the correlation between two random variables whilst controlling the effect of another (orm more) random variable that affects the original variables we are correlating.
Lets say we have three random variables of X, Y and Z. The partial correlation between X and Y, excluding the effects of Z, is mathematically:

Where r is the correlation coefficient that ranges between -1 and 1.
Partial autocorrelation is then simply just the partial correlation of a time series at two different states in time. Taking it one step further, it is the correlation between the time series at two different lags not considering the effect of any intermediate lags. For example, the partial autocorrelation for a lag of 2 is only the correlation that lag 1 didn’t explain.
Why is it Useful?
Unlike autocorrelation, partial autocorrelation hasn’t got as my uses for time series analysis. However, its main and very important impact comes in when building forecasting models.
The PACF is used to estimate the number/order of autoregressive components when fitting Autoregressive, ARMA or ARIMA models as defined by the Box-Jenkins procedure. These models are probably the most used and often provide the best results when training a forecasting model.
In future blogs I plan to explain the Autoregressive, ARMA and ARIMA models. Until then, refer to the links above to learn about these respective algorithms.
Lets now go through an example in Python in applying the PACF.
Example in Python
We will work with the airline passenger volumes dataset:
Data sourced from Kaggle with a CC0 licence.
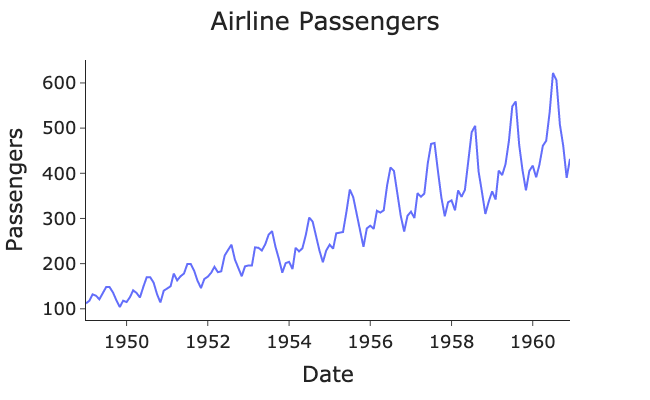
There is a clear trend in the data and an obvious yearly seasonality.
The statsmodels Python module provides a plot_pacf function to plot the PACF at different lags, this is also known as a correlogram:
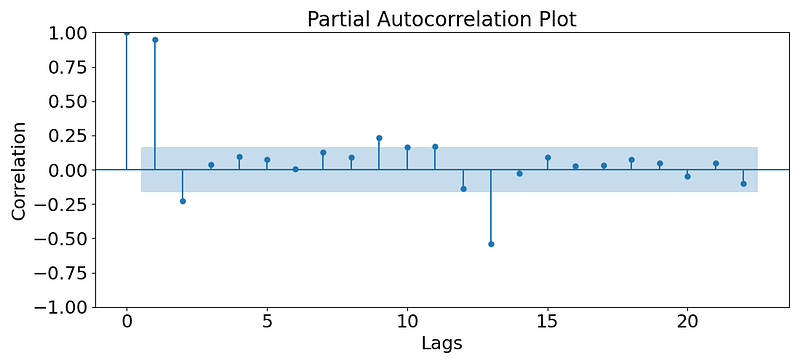
We see that lag 1 is highly correlated and there are other highly correlated lags later in time which are probably due to seasonal affects.
However, from this plot it is quite unclear how many autoregressors we would choose if we were building a forecasting model. Therefore, it is often recommended to simply carry out a grid-search over the possible parameters using modelling packages such as auto arima.
The blue region is where lags are no longer statistically significant. We typically choose the number autoregressors by seeing how many of them are above the blue region.
Summary and Further Thoughts
In this post we have gained an understanding of partial autocorrelation. This is the correlation of a time series against a lagged version of itself exluding any intermediate lags. Its primary use is in estimating the number of auto-regressors components for forecasting models such as ARMA and ARIMA.
The full code that used in this post is available at my GitHub here:
Another Thing!
I have a free newsletter, Dishing the Data, where I share weekly tips for becoming a better Data Scientist. There is no “fluff” or “clickbait,” just pure actionable insights from a practicing Data Scientist.
Connect With Me!
References and Further Reading
- Forecasting: Principles and Practice: https://otexts.com/fpp2/


