
Statistical Hypothesis Testing
Test statistics (including p-value) is a must-know concept in finance and data science. Process of test statistics can be used to help us make calculated decisions. When statisticians analyse a pattern and want to prove a claim, they attempt by finding a sample that represents the population under test. Before performing an experiment on the sample, scientists have an idea of what the expected results need to be. Please read Disclaimer before proceeding.
Test statistics process can be used to determine the needs of a population in a country, which projects to fund, future strategies of a large organisation, whether a medicine has any effect on a disease and so on.

What Is The Process Of Test Statistics?
As outlined in the article “Hypothesis Analysis Explained”, the process of test statistics consists of 5 steps:
- Start by stating your expected claim known as Null Hypothesis.
- Outline the minimum significance level/confidence level before you can reject the claim.
- Calculate your sample results mean and standard deviation
- Calculate your test statistics.
- Finally based on the outcome, claim is stated.
The chosen test statistic is dependent on the distribution of your sample. This article will focus on three different types of test statistics: T Statistic, Z Statistic and F Statistic. Each of these test statistics have their own distribution table which can be used to find the p-value to compare expected and observed results.
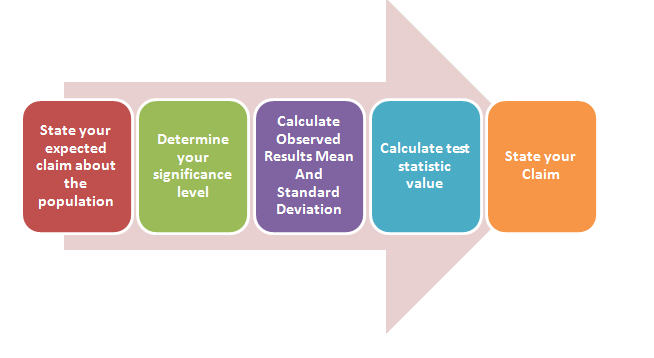
The diagram highlights the five steps. I will explain the five steps in detail below
1. State Your Claim
There are two hypothesis of any test:
- Null Hypothesis — what is known as true for the model and what we want to test. This is what we want to test.
- Alternate Hypothesis — what we need to accept if Null Hypothesis is not true. This is what we believe is true.
Suppose your colleague statistician makes a claim that the average number of software bugs in a system will reduce by 10% after all IT staff have been given training on system testing. This is the Null Hypothesis. Alternative Hypothesis is that the number of bugs are not reduced by 10% post training.
You can then test the well-known claim known as “Null Hypothesis” using test statistics.
2. Determine your significance level:
Your significance level indicates how confident you are about the results you have calculated to support your claim. It is known as Alpha. Usual value for alpha is 1% or 5%. Lower alpha implies that you are very certain about the results. Chosen confidence level forms foundation of risk management credit metrics, for example PFE @ 95%.
p-value is the minimum level of significance before a claim can be rejected.
3. Once a sample is chosen to represent a population, its mean and standard deviation is calculated. For example, to test the claim that training reduces bugs, you can train 50 developers out of 1000 developers in your company and test if the number of bugs are reduced by 10%. The sample of 50 developers is representing the population of 1000 developers. Once you have the observed results, the question to ask is:
- Was this by chance?
- Can you trust the sample you chose?
This brings us to the core of the article: Calculating Statistical Test
There are three well known test statistics: T, Z and F. These test statistics have their own properties, formula, and usages.

T Statistical Hypothesis Test:
Used for testing means of two small populations.
- Sample follows: Student T Distribution For Null Hypothesis to be true
- Sample Size: Less than 30
- Population Standard Deviation: Unknown
- Formula To Calculate T Stat:
- [Sample Mean — Hypothesised Population Mean]/[Standard Deviation Of Sample/ SquareRoot(Sample Size)]
- Example: You have a sample of 10 cars and you want to measure average fuel consumption of all cars in the town. Your hypothesised claim is that on average, cars consume 10 liter of fuel per day. Let’s also consider that you are 99% confident in the methodology. You can then compare the hypothesised mean with the sample mean and work out if you need to reject Null Hypothesis based on T distribution table at 99%.
Z Statistical Hypothesis Test:
Used for testing means of two large populations.
- Sample follows: Normal Distribution For Null Hypothesis to be true
- Sample Size: Greater than 30
- Requires that the conditions are reliable
- Population Standard Deviation: Known
- Formula To Calculate Z Stat:
- [Sample Mean — Hypothesised Population Mean]/[Standard Deviation Of Population/ SquareRoot(Sample Size)]
- Example: Assume you have collected sample of 50 men to compare the average number of people wearing blue shirts in a population. Let’s also consider that you are 95% confident in your model. You can then compare hypothesised mean with the sample mean and work out if you need to reject Null Hypothesis based on Z distribution table at 95%.
Standard deviation/Sqrt(sample size) is the sample standard error.
This is the noise/dispersion of sample from the mean. This measure is based on the sample size. The formula indicates that larger the sample size, lower the impact of standard deviation and closer the sample value is to the population value.
T vs Z Test Statistics
Important to note that Z and T stats differ in how standard deviation is taken in the denominator. T stat takes sample standard deviation and Z stat uses population standard deviation.
F Statistical Hypothesis Test:
Used for comparing variances of two populations. Variation is the sum of the squared deviations of each observation from its group mean divided by the error degree of freedom. If you want to test joint hypothesis then t or z test are not enough. F test can be used to compare properties of two samples:
- Sample follows: F Distribution
- Sample Size: Any size
- Sample Standard Deviation: Unknown
- Formula:
- [Variance of sample 1]/[Variance of sample 2]
- Unlike t or z tests that can assess only one regression coefficient at a time, F-test can be used to assess multiple coefficients simultaneously.
- Example: You want to compare variability of software bugs in two IT systems in your company.
- You can use F-statistics to test the overall significance for a regression model, to compare the fits of different models, to test specific regression terms, and to test the equality of means.
Use F-value in the F-distribution to calculate probability, known as p value. If the probability is low enough, we can conclude that our data is inconsistent with the null hypothesis.
F-test in regression model compares fit of different linear models. F-test of the overall significance is a specific form of the F-test. It compares a model with no predictors. A regression model that contains no predictors is also known as an intercept-only model.
5. State your Claim:
For two tailed test (more in Hypothesis Analysis Explained), for example when a Null Hypothesis is considered to be within a range then size of a sample, calculate the test statistic value and then check if the calculated value is within the range from the distribution table.
Let’s assume we got 0.50 as the Z statistic value. Our target claim from Z-distribution table is that the expected value needs to be within -1.96 to 1.96. As -1.96 < 0.50 < 1.96, we can safely accept the Null Hypothesis.
This hypothesis could also be tested on regression analysis whether x and y have any relationship.

Example:
If you have mean and standard deviation of a sample and you are asked to calculate 95% confidence interval of two tail test then:
1. Calculate standard error first.
Remember it’s standard deviation / sqrt( sample size)
2. Choose your test statistic: Is it T, Z or F test problem? From what we learnt above, if we know the standard deviation of the sample and sample size is >30 then it is a Z Test. Z test means your sample test statistic follows a normal distribution. You can find Z distribution table to find Z value of 2.5 percentage. This gives you +/-1.96. Anything out of this range invalidates your null hypothesis. From your significance level (say 5%), as this is a Two Tail test, find the Distribution table for values: +/- 2.5% (2.5% because 5/2 =2.5. We divided alpha by 2 because 2 is the number of tails in the test). If it is a Z test then Look up 2.5 in Z statistics table. This then gives us our minimum threshold values of our test statistic: z+ = 1.96 and z- = -1.96 If the calculated z statistic > 1.96 or <-1.96 then reject the Null Hypothesis. P(Z>1.64) = 1–0.095 = 5%
Feed in respective values to your test statistics formula:
- Z Test Formula: [Sample Mean — Hypothesised Population Mean]/[Standard Deviation Of Sample/ SquareRoot(Sample Size)]
- [Standard Deviation Of Sample/ SquareRoot(Sample Size)] is the standard error of sample mean
For us to accept null hypothesis, hypothesised value needs to be within the range of -1.96 to 1.96.
Can we use R squared to check if relationship is statistically significant?
R squared measures strength of relationships between dependent and independent variables. In my article “How Do I Predict Time Series?”, I explained how R squared is calculated. While R-squared provides an estimate of the strength of the relationship between your model and the response variable, it does not provide a formal hypothesis test for this relationship. The overall F-test determines whether this relationship is statistically significant. If the P value for the overall F-test is less than your significance level, you can conclude that the R-squared value is significantly different from zero.
Lastly, A Brief Outline Of Chi Square
If the sample follows chi square distribution then use chi sqhared test to find the p value. The steps remain the same as above except the formula of test statistics is:
([sample size — 1] x sample variance) / hypothesised population variance.
Summary
In this article, I outlined basics of test statistics including T, Z and F Test Statistics. We understood that the process of test statistics can be used to help us make calculated decisions. The process of hypothesis analysis is explained here: Hypothesis Analysis Explained
Hope it helps.


