
Pandas vs. Polars — Time to Switch?
Looking to speed up your data processing pipelines up to 10 times? Maybe it’s time to say goodbye to Pandas.

In a world where compute time is billed by the second, it’s only logical to minimize it as much as you can. And then some.
Python’s vast data processing ecosystem is great for beginners, but challenging to scale up as dataset size grows. Parallel processing, query optimization, and lazy evaluation are all things unheard of in Pandas, but are concepts you must wrap your head around if you want to use Python in large-scale production environments.
Enter Polars. It’s a Python library written from the ground up with performance in mind. Polars has a multi-threaded query engine written in Rust, which means you should expect to see blazingly fast data processing times, even 30–50 times faster than Pandas.
Today you’ll see how Polars compares to Pandas in a series of 4 benchmarks performed on a CSV file with 11 million rows.
But first, let’s go over the reasons why you should even consider Polars as a Pandas alternative.
Pandas vs. Polars — Why Should You Consider Polars as a Data Professional
If Python was the first programming language you learned, I’ll guess your first data processing framework was Pandas. Nothing wrong with that, especially on a beginner level.
But as soon as datasets get large, you’ll run into performance limitations.
The biggest one is the single-threaded nature of Pandas. Datasets are getting bigger by the day, so leveraging only one CPU core doesn’t sound reasonable. Parallel and/or distributed processing are your friends.
Adding insult to injury, Pandas requires you to store the entire data frame in memory, which isn’t efficient at best, and downright impossible when working with larger-than-memory datasets.
Lastly, Pandas doesn’t offer order of operation optimization. This means the data processing operations will be applied in the order in which you declared them, which is rarely optimal. You don’t know best and that’s okay.
Polars to the Rescue
Polars is a Python and Rust based library for processing large volumes of data fast.
It’s written in Rust (a programming language that has C/C++ performance) and offers data processing benefits Pandas simply can’t match:
- Parallel computing — You can utilize all available CPU cores on your machine.
- Query optimization — Drastically reduces memory allocations by using query planning and lazy evaluation. You’ll see the latter in action in one of today’s benchmarks.
- File scanning — Allows you to work with larger-than-memory datasets by only reading their schema, and not storing the entire thing in memory.
- Improved copy-on-write — Polars uses Apache Arrow to improve storage performance.
And much, much more.
The best part? Switching from Pandas to Polars requires minimal code changes, as their APIs are quite similar.
You now know which shortcomings Polars addresses. The next step is to see it in action, so let’s get right to it.
Benchmark Prerequisite — How to Create a Large Dataset in Python
First things first, you’ll need some data. The following snippet creates a random data frame containing made-up sales amounts across 125 years (hourly intervals) and 10 office locations.
That should give you around 11 million rows to play with:
import uuid
import numpy as np
import pandas as pd
import polars as pl
from datetime import datetime


date_ranges = pd.date_range(start=datetime(1900, 1, 1), end=datetime(2025, 12, 31), freq="h")
locations = ["Italy", "France", "Spain", "Portugal", "Greece", "Germany", "Austria", "Norway", "Sweeden", "Poland"]
location_multiplier = [0.7, 1.2, 0.9, 0.5, 0.3, 1.0, 1.4, 1.9, 2.1, 1.4]

data = []

print("Started constructing data...")

for dt in date_ranges:
    for i, loc in enumerate(locations):
        data.append({
            "id": str(uuid.uuid4()),
            "date": dt,
            "location": loc,
            "sales": np.random.randint(low=1, high=50) * location_multiplier[i]
        })

print("Finished constructing data!")
print("Converting to dataframe...")

data = pd.DataFrame(data)

print("Finished converting to dataframe!")
print("Saving to CSV...")

data.to_csv("data.csv", index=False)

print("Saved to CSV!")
print("Done!")
If you’re wondering, the string UUID column is here only to make the dataset larger and slower to read.
Let’s print the shape and data sample, just to verify everything looks good:
print(data.shape)
print()
data.sample(10)
These are the results:
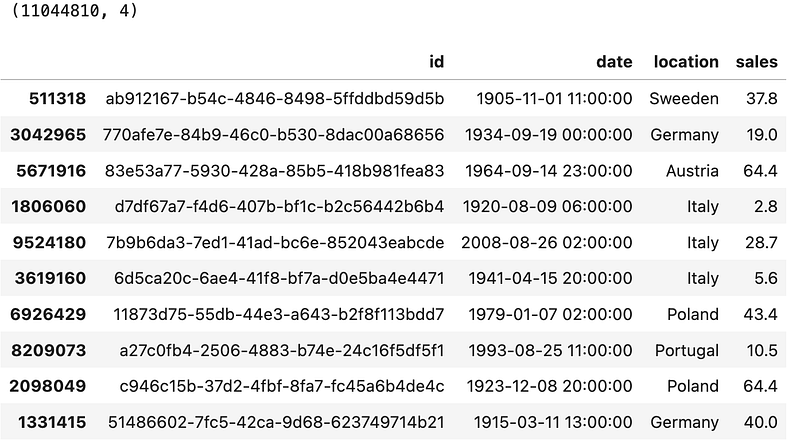
Looks good! You have a dataset of 11.04 million rows that takes around 800MB of disk space. Not a whole lot, but should be enough to see if there are significant differences between Pandas and Polars.
If you want more data, simply play around with the date aggregation frequency. Swapping hours for minutes will get you over 660 million rows. Good luck with that.
Pandas vs. Polars — Data Processing Benchmarks
I’ve run each benchmark 3 times and averaged the results. The hardware of choice is an M2 MacBook Pro with 16GB of RAM and 12 CPU cores. Library versions are as follows:
pandas— 2.2.1polars— 0.20.18
Benchmark #1 — Reading a CSV File
The first task of almost any data pipeline is getting the data. The file format of the day is CSV, and both Pandas and Polars have an identical read_csv() function you can use.
# PANDAS
df_pd = pd.read_csv("data.csv")


# POLARS
df_pl = pl.read_csv("data.csv")
The API might be the same, but the behind the scenes implementation surely isn’t:
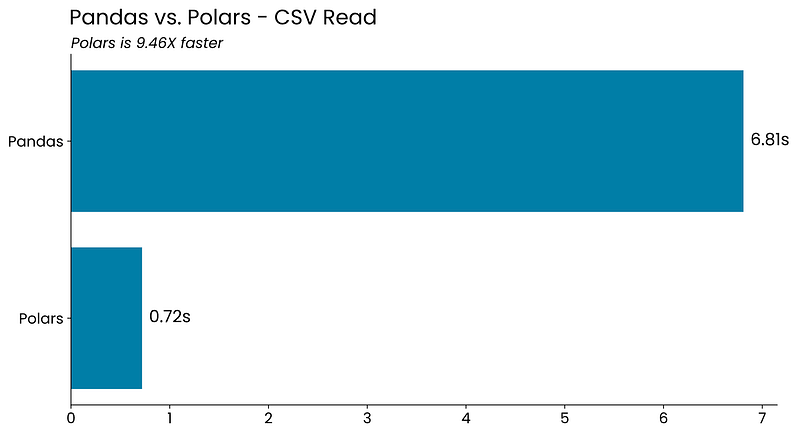
Polars is almost 10 times faster than Pandas when reading an 800MB CSV file from disk.
Benchmark #2 — Reading and Preprocessing a CSV File
Dataset reading is usually immediately followed by data preprocessing, such as data type conversions and filtering. That’s the use case I’ll test here.
The goal is to read the CSV file once again, convert the string date column representation to actual datetime objects, keep only the rows for the Italy office location, and remove unnecessary columns.
Implementation between Pandas and Polars looks a lot different at first, but a seasoned Pythonista should have no trouble navigating between the two:
# PANDAS
df_pd_italy = pd.read_csv("data.csv")
df_pd_italy["date"] = pd.to_datetime(df_pd_italy["date"])
df_pd_italy = df_pd_italy[df_pd_italy["location"] == "Italy"]
df_pd_italy = df_pd_italy[["date", "sales"]]


# POLARS
df_pl_italy = (
    pl.read_csv("data.csv")
      .with_columns(pl.col("date").str.to_date("%Y-%m-%d %H:%M:%S"))
      .filter(pl.col("location") == "Italy")
      .select(pl.col(["date", "sales"]))
)
Polars is faster once again:
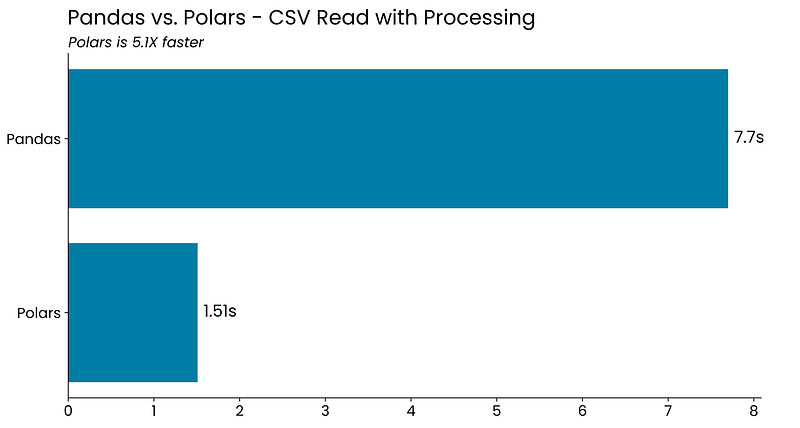
Only 5 times faster now, but still significant.
Benchmark #3 — Group By
One of the most common data operations is grouping. The idea is to condense the information and show summary statistics, such as totals and averages, across different groups.
The below code snippet groups the data by year and location and then calculates the total and average sales. The resulting data frames are sorted by date in ascending order, and by total sales in descending order:
# PANDAS
(df_pd
    .groupby([df_pd["date"].dt.year, df_pd["location"]])
    .agg(
        total_sales=("sales", "sum"),
        avg_sales=("sales", "mean")
    )
    .reset_index()
    .sort_values(by=["date", "total_sales"], ascending=[True, False])
)


# POLARS
(df_pl
    .group_by([pl.col("date").dt.year(), pl.col("location")])
    .agg(
        pl.sum("sales").alias("total_sales"),
        pl.mean("sales").alias("avg_sales")
    )
    .sort(by=["date", "total_sales"], descending=[False, True])
)
There are ever so slight differences between Pandas and Polars APIs, mostly shown in function and parameter names. But really, this shouldn’t be a deciding factor.
Let’s take a look at the results:
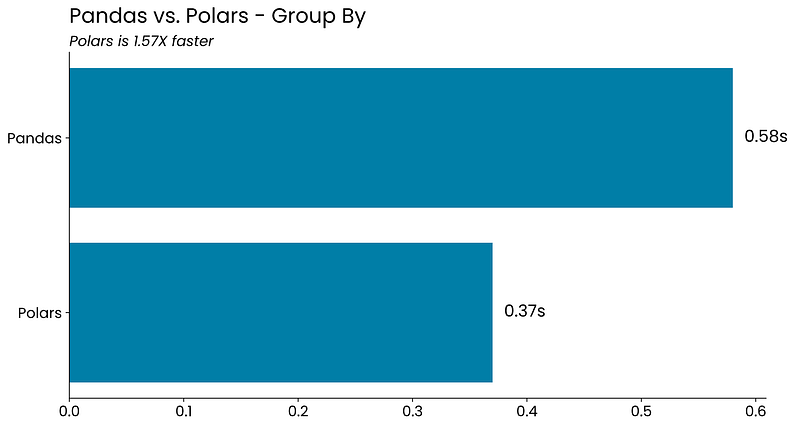
Polars is faster yet again, but not by a huge margin. This grouping operation didn’t take much time in the first place, so that’s the main reason why.
Benchmark #4 — The Complete Pipeline
Comparing Pandas and Polars among individual operations is fine, but most data professionals only care about the total time it takes for their data pipeline to finish.
That’s where Polars packs an extra punch. It ships with a lazily evaluated data frame version called LazyFrames. The idea behind them is to set up a computation graph and let Polars optimize the order of execution.
You don’t have to lift a finger, but note how you’re now using the scan_csv() function instead of read_csv(). Long story short, this function creates a LazyFrame that references the file’s data instead of reading it from disk. A caveat is that you have to call the collect() function manually, as no data processing will happen before you do — hence, lazy:
# PANDAS
df_pd = pd.read_csv("data.csv")
df_pd["date"] = pd.to_datetime(df_pd["date"])

df_pd_res = (
    df_pd
        .groupby([df_pd["date"].dt.year, df_pd["location"]])
        .agg(
            total_sales=("sales", "sum"),
            avg_sales=("sales", "mean")
        )
        .reset_index()
        .sort_values(by=["date", "total_sales"], ascending=[True, False])
)


# POLARS
df_pl_res = (
    pl.read_csv("data.csv")
        .with_columns(pl.col("date").str.to_date("%Y-%m-%d %H:%M:%S"))
        .group_by([pl.col("date").dt.year(), pl.col("location")])
        .agg(
            pl.sum("sales").alias("total_sales"),
            pl.mean("sales").alias("avg_sales")
        )
        .sort(by=["date", "total_sales"], descending=[False, True])
)


# POLARS WITH LAZY EVALUATION
df_pl_lazy_query = (
    pl.scan_csv("data.csv")
        .with_columns(pl.col("date").str.to_date("%Y-%m-%d %H:%M:%S"))
        .group_by([pl.col("date").dt.year(), pl.col("location")])
        .agg(
            pl.sum("sales").alias("total_sales"),
            pl.mean("sales").alias("avg_sales")
        )
        .sort(by=["date", "total_sales"], descending=[False, True])
)

df_pl_lazy_res = df_pl_lazy_query.collect()
But the additional function call is worth it:
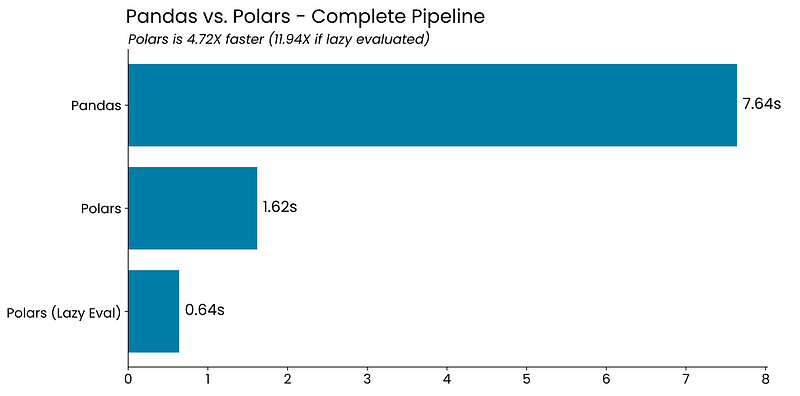
Polars turns out to be almost 5 times faster for the entire pipeline when compared to Pandas. If you use its lazy API, the difference jumps to almost 12 times.
It’s impressive how much of performance gains you can get with minimal code changes.
Summing up Pandas vs. Polars
Working with Polars is lightning fast when compared to Pandas. Every operation shown today was faster, and it turned out you could speed up the entire data processing pipeline 12 times by switching from Pandas to lazily evaluated Polars.
If that’s the case, why are most data professionals still using Pandas? Well, it comes down to familiarity and a broader ecosystem. Pandas is probably the first data processing framework most people have learned, and there’s more awareness around it. Change only gets harder with time.
Pandas is also a superb choice for small to medium-sized datasets. But when data gets larger than memory, it’s not even close. Polars wins by a mile.
Have you replaced Pandas with Polars in your workspace? What challenges did you encounter? Please share in the comment section.
Read next:


