
Pandas for Data Science: A Beginner’s Guide, Part I
Begin learning the essential Pandas methods to begin creating data science projects with Python, head(), info(), sum(), and describe().

I. About Pandas for Data Science in Python
Pandas is a data analysis library that is built on top of Python. This flexible library is useful for manipulating and analyzing data in a variety of structures, however it is especially useful for tabular data, like SQL tables and Excel spreadsheets. In this tutorial, I will focus on the most essential functions for wrangling labeled tabular data in Pandas with Python.
II. Getting Some Data
- Follow this link to Kaggle and download the Metal Bands by Nation data set into your project directory.
2. Open up your terminal, navigate to your project’s directory, and open a Jupyter notebook with the following command:
$ jupyter notebookIn your browser, a new tab will open up that contains the project directory. On the top right, you’ll see drop down menu that reads “New”. From the drop down, select the name of your virtual environment. This will create a new Jupyter notebook that uses the packages you have installed into that virtual environment.
If you are having trouble, you might want to refer to this tutorial to ensure your virtual environments and Jupyter notebook are set up correctly.
III. Exploring Pandas
3. Check to ensure that you’ve installed Pandas, Matplotlib, and Seaborn. If you’re not sure how to install them, check out this tutorial.
4. Once you have Pandas, go back over to the Jupyter notebook and in the first cell, enter:
import pandasThis command import the pandas library for use in your Jupyter notebook.
With libraries like Pandas, it is typical to use an alias, or shortened name, so that we can use the library more easily in our code. To use the alias, delete the information in the first cell, enter the following, and key in Shift + Enter to execute the cell.
import pandas as pdNow, when you use a Pandas function, you can use the alias.
5. In the next cell, we are going to read in the spreadsheet that we downloaded earlier. To do this, enter the following:
df = pd.read_csv(“metal_bands_2017.csv”)- df is the name we are using for the variable that’s going to store the spreadsheet, which now becomes a Pandas data frame.
- = is what is used to assign an data to a variable
- pd is the alias for Pandas — the library we are using to read the file
- read_csv() is the method in the Pandas library that performs this function
- “metal_bands_2017.csv” , (within the parentheses) is the name of the file we wish to work on
6. Now, we can begin to inspect the data frame by entering the following into a new cell in the notebook:
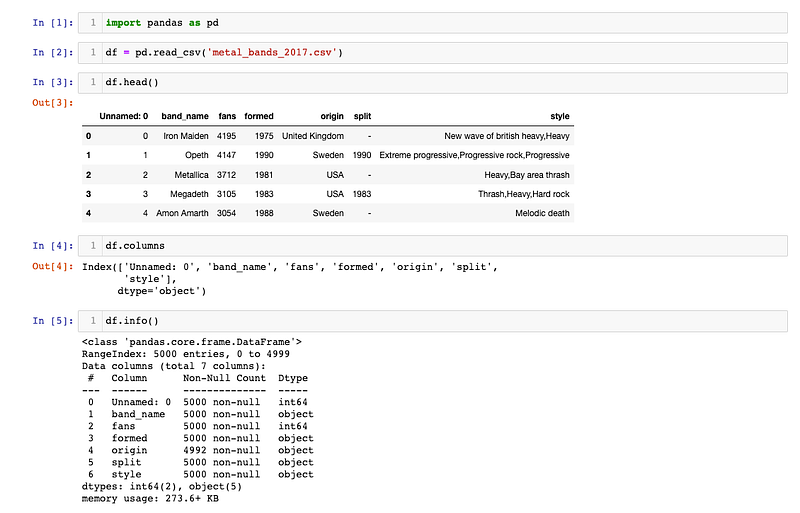
df.head()This method is a way that you can view the first five rows of the data frame. Placing an integer within the parentheses allows you to see that many rows in ascending order. Alternately, df.tail() will allow you to see the last five rows. Doing this gives us a quick assessment of the format and quality of the data.
7. To see all of the names of the columns, you can use:
df.columnsThis will return a list of columns.
8. Next, we want to know what kind of data we are working with. To find out, we can use:
df.info()This brings up a little report with all of the column names, their data types, and the number of null values.
So far, your notebook should look something like this:
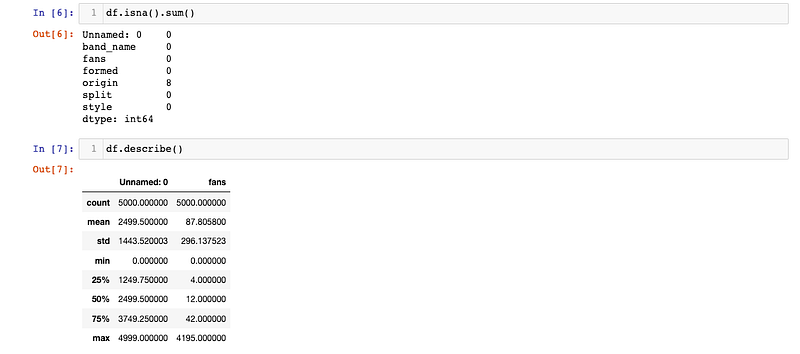
9. If you’d like to see just the null values, enter:
df.isna().sum()10. Finally, if you want to find out some descriptive statistics you can use:
df.describe()It should look something like this:
11. If you’re following along with the Data in a Day series, save this notebook for next time and call it “MyProject.ipynb”.
IV. What Did We Do?
- Learned how to launch Jupyter from the command line, open a new notebook, and import a package (Pandas).
- Explored Pandas and learned some of the basic methods for data analysis.
Keep reading Essential Pandas II to continue inspecting and transforming the Metal Bands by Nation data set with Python and Pandas. In that tutorial, I explain how to deal with missing values using methods like drop() and isna().