
Pandas describe() function — Deep Dive
How important is the describe() function in Pandas library?
TL;DR: It is very important to know the nitty gritty of the describe function.
So, if you’re interested in Data Science topics and Python is your preferred programming language, you’ve probably came across the describe() method in Pandas’ library. When you obtain a new dataset, you usually run the describe command and then move on to cleaning it up, but do you truly dig into the findings produced by the describe function? If you don’t, this is the article for you. It will forever alter your approach to the describe function.
What is Pandas library?
Pandas is an open-source library developed by Wes McKinney, and instrumental to data analytics and data wrangling. Pandas is not included with any Python release and must be installed independently using the command:
pip install pandasIn addition to offering access to several data structures and methods for manipulating data, Pandas is well recognized for its Dataframe API. The Dataframe API may be compared to an interactive table that allows users to slice and dice different portions of interest or enable other types of operations like merge, join, broadcast, etc. In this article, we will just concentrate on the describe() function included in the Pandas library.
Describe()
What exactly does this describe function perform, and why is there so much hype surrounding it?
Describe, as the name suggests, describes the data distribution and provides various metrics to understand hidden patterns in the data distribution. In order to call the describe function on a dataframe one has to just issue the describe command:
raw_data.describe(include="all")This command returns a lot of things and let us try to analyze the output one step at a time.
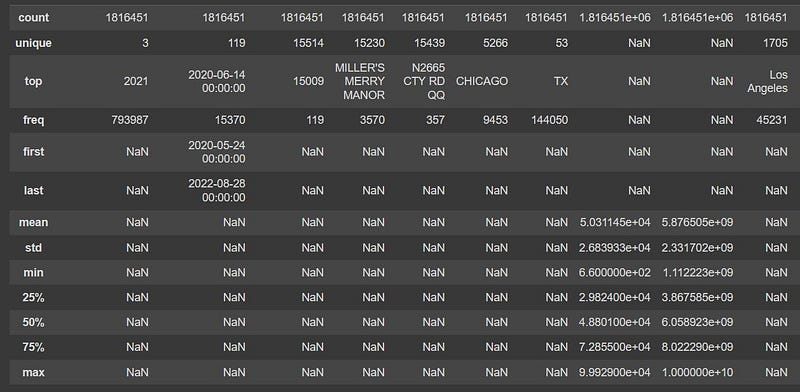
- count — This is the first row which is returned and essentially contains a count of the number of records (rows) present in that column.
- top — This is only applicable for nominal — categorical, object and datetime data types and essentially provides the mode of these data types.
- freq — This is also applicable for nominal — categorical, object and datetime data types and essentially provides the frequency of the mode (or the “top”) of any data distribution.
- first, last — It is applicable only for datetime data types and provides the starting and ending point reference of datetime variables.
- mean — It is only applicable for ordinal — numeric data types and provides the arithmetic mean of the variable.
- std — It is only applicable for ordinal — numeric data types and provides the standard deviation of the variable.
- min — It is only applicable for ordinal — numeric data types and provides the minimum value for that column.
- max — It is only applicable for ordinal — numeric data types and provides the maximum value for that column.
- 25% — This provides the value of the lower quartile or first quartile or 25 percentile of the data. It is also denoted as Q1. It is only applicable for ordinal — numeric data types.
- 50% — This provides the value of the second quartile or 50 percentile of the data. It is also denoted as Q2 and is also called as the median of the data. It is only applicable for ordinal — numeric data types.
- 75% — This provides the value of the upper quartile or third quartile or 75 percentile of the data. It is also denoted as Q3. It is only applicable for ordinal — numeric data types.
All these information is directly available by issuing the describe() command.
Why is the describe command important?
- The describe command is important because it provides us information related to all the central tendencies in one place, and even before we start analyzing the data we can create a “mind-map” of the dataset using these values.
- The probabilistic distribution of the data can be easily understood using the describe command. In addition, various confidence intervals at 95%, 97% and 99% of the data distribution can be easily viewed using the describe command.
- Also various other metrics like range, inter-quartile range, mean plus three standard deviations which are common statistics metrics used by Data Scientists on a regular basis can be easily deciphered using this command.
- It also helps greatly in understanding the skewness in the data early on in the analysis stage and based on that certain necessary steps can be taken.
- For some nominal variables, the describe command can be used to understand whether the data is balanced or imbalanced.
Describe Parameters
The describe function can take various parameters as below:
DataFrame.describe(percentiles=None, include=None, exclude=None, datetime_is_numeric=False)- percentiles — Here we can specify which specific percentile we want to see in the data. Be default pandas provides the first three quartile information, that is, 25%, 50% and 75%. However, one can easily add more percentile information or completely alter extra additional percentile information which can be obtained from the data, for example, 95%, 97% and 99% by simply using the parameter as:
percentile = [.25, .5, .75, .95, .97, .99] - include — This parameter helps to selectively include some or “all” the columns into the describe output. If no parameter is provided, by default pandas will compute the statistics for only the ordinal columns. If only selective columns information is required (especially in the case of a large dataset with huge number of columns), the column names can be provided as a list input. To include only categorical columns, the parameter “category” needs to be provided only.
- exclude — Very similar to the include parameter but use to exclude some, “all” or selective set of columns from the describe output. The way to specify them is also the same as the include parameter.
- datetime_is_numeric — This parameter essentially refers whether the datatime columns should be treated as numeric or not. By default it is set to False.
That is all about the describe() function in Pandas. Hope you liked this article, and follow me for more related content on Data Science, Artificial Intelligence and Machine Learning!!