ON the attribution and decomposition of mix and rate effects
Getting a better grasp of what moves your metrics through a methodological way to get insights on metrics’ variations

What is a mix-effect
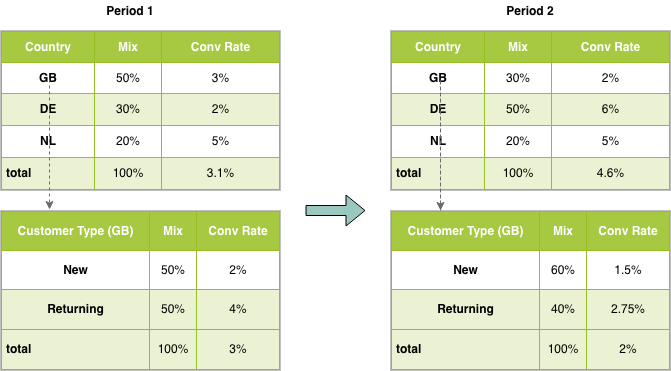
Mix Effect allows to point point what part of the variation is due to a change in mix. If we take an example of an e-commerce site active in 3 different countries and wanted to get a better sense on the evolution of its’ conversion rate. We would want to know what part of the change in the overall conversion rate between the periods is structural, vs. what part of that change is due to selling more/less in markets that might have a conversion rate significantly different from average.
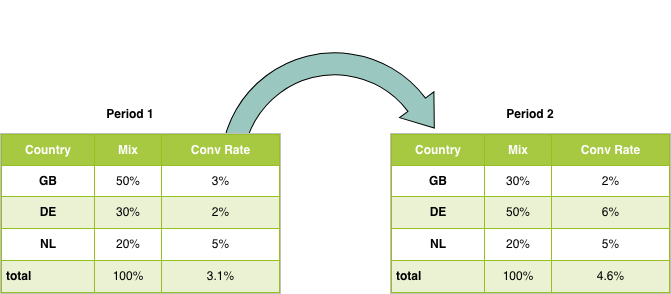
In the above tables, the overall conversion rates are taken as a weighted average of each countries conversion rate.

Our overall conversion rate increases from 3.1% to 4.6%, from the picture above we can see that we have both a change between the composition and in each of the countries performance. The challenge in understanding mix effects lies in understanding what is the impact attributable to a change in mix on our actual metrics of interest.
Mix Impact Calculation
The mix impact of transitioning from period 1 to period 2, can be taken as the difference in mix, multiplied by the new conversion rate.

Plugging the numbers in from the previous example into this equation yields the answer of -0.2% of an impact of the mix effect.
In the case of our example, the volume shifted from period 1 to period 2 from GB, which had a conversion rate of 3% to DE with a conversion rate of 2%, since we moved volume from a country with a higher conversion rate at the time to a country which had a lower conversion rate, we have been negatively impacted by the mix.
As we can see not all the 1.5% difference in overall conversion rate is explained by a pure mix effect. This is due to the rate effect of the individual’s cell conversion rate.

Similarly to the mix impact in can easily be calculated by plugging the numbers in the formula.
The sum of the mix impact and of the rate impact should bridge the gap in conversion rate between the two period. Notably here, -0.2% + 1.7% sums to 1.5% which is the difference in conversion rate between the second period and the first.
Parallel Mix Impact Calculation
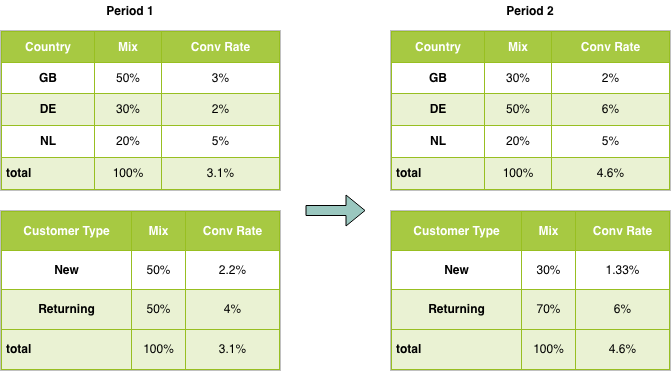
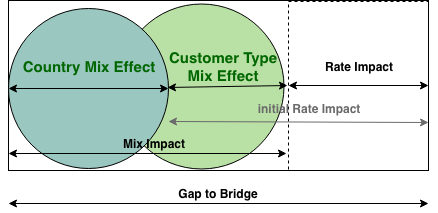
It is often the case that we want to understand the impact of mix across multiple dimensions, for instance catering to both country and customer types. One of the method ton do that is a parallel mix calculation, we estimate the mix impact of each of these factors independently. As such we obtain an estimate for both the mix impact due to country and to customer types, in the case pictured above it would be respectively -0.2% and 0.36%.
We can see from this approach that the method that we used previously to calculate the rate impact does not really makes as much sense anymore using that approach. There are multiple reasons for that:
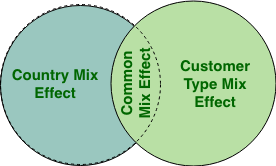
The first reason that is specific to the parallel mix calculation, is that there is a common mix effect between the country mix and the customer type mix and we are not taking it into account when trying to bridge the gap between the different periods.
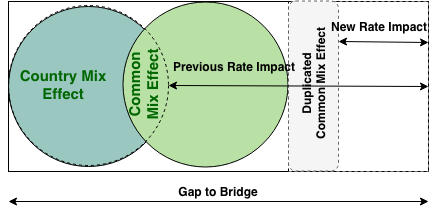
The Second reason, which is more general is that we are implicitly controlling for more factors, and what would have been previously been attributed to a rate impact is now identified as an impact to to customer type mix.
Sequential/Hierarchal Mix impact calculation
If instead of taking into trying through a sequence of actions, first controlling and attributing impact to one of the mix effect and then the other, we would be able more effectively bridge the gap due to mix. The consequence of that is that we might under or overstate the effect of certain mix changes.
In order to be able to setup a sequential bridging of the mix effects, we need to go at more granular data than previously showcased. We need to be controlling for the mix within the specific dimensions, a sort of “intra-mix”.
Looking at it in a different way, we need to identify which part of our initial rate impact when we were only considering a single mix dimension is due to a change in mix within each cell. For instance, looking at the difference of -1% in conversion rate which part of that difference is attributable to a customer type mix within the country. This is the type of insight that a Sequential mix impact calculation would provide.
In the case of GB for instance, we can see that there is an intra-mix effect contributing -0.2% out of that -1% cell rate change. This can be computed by reapplying the mix effect formula previously seen to this particular sub scenario. In order to attribute it back to the impact on GB we need to plug back the mix for GB in period 2. In this case 30%*(-0.2%)=-0.06%.
We know that the contribution to the overall conversion rate of the rate change from GB is 30%*-1% = -0.3% and we can see that this can also be computed as a rate impact complement to the previously computed intra-mix. Calculating the rate impact of Customer Type in GB, we get -0.8%, applying it back to the mix of GB in period 2, we get -0.24% (-0.8%*30%) which summed up with the -0.06% ties back to the -0.3% that we have from rate originating from that line item.
Reapplying the same logic for all the different country cell, allows to calculate the impact of customer type within the countries and separate it from the overall rate calculations.
Rate Decomposition
In certain cases, we are able to decompose the rate metrics into a product of different sub metrics. For instance in our example of a conversion rate, the metrics is defined as Conversions / Sessions. We can for instance have the overall conversion rate defined as the product of a non-bounced rate and a conversion rate for non-bounced sessions.

Mathematically decomposing the metrics allows to have a more granular view on the different levers that we can action and be able to calculate their contribution to the overall changes. As we have seen with the calculation of the mix previously, we can attribute the impact on decomposed metrics, by changing moving them one towards the new period, one at the time.
For instance, could calculate the impact of a non-bounced (NB) rate as:

And the impact of the non-bounced sessions conversion rate (CR) as :

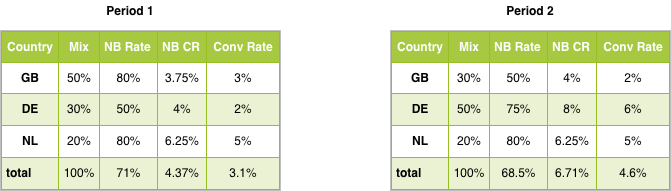
The table above shows how the conversion rate has been decomposed into a Non Bounce rate and a Non Bounce Conversion Rate for each of the countries. If we want to understand what is the contribution of the change in Non-Bounced rate of GB on the total conversion rate, we would have: 30%*(50%-80%)*3.75% =-0.3375%. And for the change in NonBounced Conversion rate, 30%*50%*(4%-3.75%) = 0.0375%. The sum of both of these effects summing up to the previously computed -0.3% rate contribution originating from GB.
Wrapping up
Both mix and rate impacts allows to have a better understanding on the evolution of your product or business, through the measurement and attribution of impact for both mix shift factors and rate factors. It gives a better understanding of how improvements that have been made, have really contributed to the success of your product/business and how other factors might have affected it.
Having a methodological approach to attributing and decomposing these factors impacts, imposes a disciplines that benefits both data collection and its ability in influencing business decision. Being able to backtrack the changes that happened and ascribe impact/value to it, both set forth a sense of scrutiny on the business performance and confidence in data driven recommendations.
More from me on Hacking Analytics:


