
Odds and likelihood ratios
Likelihood ratios can help in diagnostic testing and decisions.
During the pandemic, people get different tests. Someone may do a rapid lateral flow device test. If that is positive, they could then get a polymerase chain reaction (PCR) swab test. What if the PCR test returns negative, thus giving conflicting results?
Odds and probabilities
In classical statistics, probabilities are relative frequencies of an event over many trials. If you roll a fair six-sided die lots of times, it will come up ‘5’ one-sixth of the time.
Odds are a ratio. It is the probability an event will occur divided by the probability that event will not occur. For our fair die, the odds of the die coming up ‘5’ are one to five (or 0.2). This is because there is one side that our chosen event, versus five other sides. If there was an event with 80% probability, then the odds would be four to one (or 4).
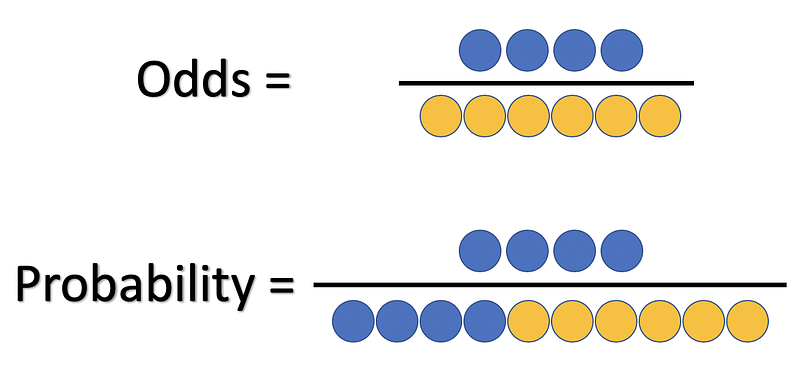
We can also convert those odds to the probabilities. The probability is the odds number, divided by the odds number plus 1. For instance, suppose the odds were 0.2 (or one to five). The probability is then 0.2 divided 1.2, or 1/6. That recovers the probability of a ‘5’ on a fair six-sided die.
Applying the likelihood ratio
In diagnostic testing, the likelihood ratio is:
- the probability of results when someone has the virus, divided by the probability of results if they do not have the virus.
Imagine you were in a rather surreal legal case, about whether you were harbouring a virus. This ratio is the balance of evidence favouring the prosecution, who say you have an infection.

Suppose we have a rapid test which has a false-negative rate of 20% and a false-positive rate of 0.1%. The confirmatory test — taken only if the rapid test is positive — is more accurate. Its false-negative rate is 5%, with a false-positive rate of 0.005%.
What if the confirmatory test comes back negative? There are two scenarios:
- The person has the virus: a true-positive rapid test (80% probability), then a false-negative confirmatory test (5%).
- The person does not have the virus: a false-positive rapid test (0.1%), then a true-negative confirmatory test (99.995%).
The numerator is then 0.8 multiplied by 0.05, equal to 0.04. The denominator is 0.001 times by 0.99995, which is close to 0.001. The resulting likelihood ratio is a little over 40 (0.04 divided by 0.001).
Applying Bayes’ Theorem, the prior odds multiplied by the likelihood ratio gives the post-test odds. We can then convert those odds into probabilities.
Suppose someone has a conflicting set of results. They got a positive rapid test, but their confirmatory test came back negative. If the prevalence among rapid testers is 2.5% or higher, then this person is more likely than not to have an infection.
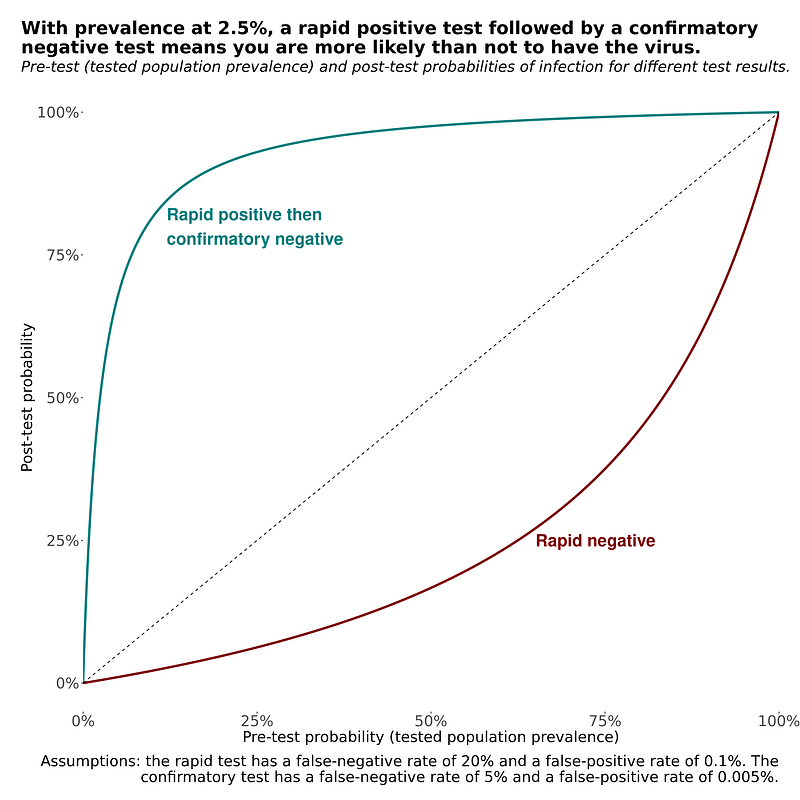
The underlying viral prevalence affects the interpretation of conflicting test results.
The R code to produce the graphs is available on R Pubs and GitHub. This is my extension of the co-written article with David Spiegelhalter in The Observer.


