
Non-Linear Correlation Matrix — the much needed technique which nobody talks about
Why correlation matrix is over-used and why you need a non-linear correlation matrix

Even though there are uncountable data science techniques and algorithms, sometimes you still have the feeling that something is missing. One such thing which is missing or not much talked about is a non-linear correlation matrix.
We are used to the famous correlation matrix. However, in this article, you will see that a correlation matrix can potentially lead to the wrong interpretation of data. The limitations of a correlation matrix justify the need for something more sophisticated such as a non-linear correlation matrix.
In order to illustrate this story, I will be using a dataset on cars. A sample dataset is shown here. The data which we will be using in this video is related to cars. The data has got make of the car, different technical characteristics such as fuel type, length, width, number of doors, etc. as well as the price of the car. The data has about 25 fields, out of which there are about 15 numeric fields.
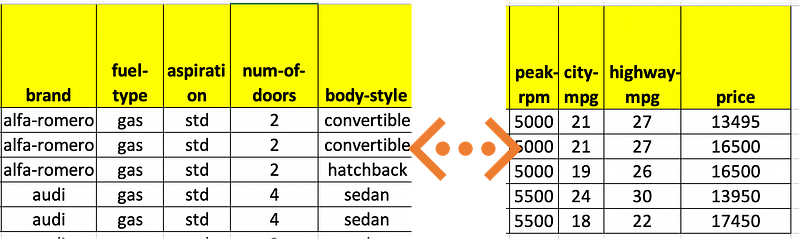
Note: The dataset citation is available at end of the article
The Correlation matrix…too good to be true
Let us first start by examining the correlation matrix. The dataset has more than 15 numeric fields. A correlation matrix measuring the correlation between these numeric fields is shown below.
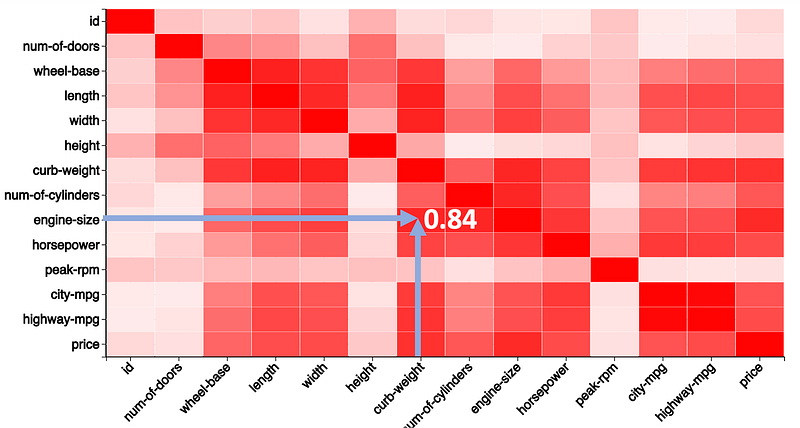
The X and Y-axis correspond to the numeric fields in the data. Each cell has a correlation coefficient indicating the strength of correlation between two fields. Higher is the correlation coefficient, darker is the color.
The correlation coefficient between engine size and weight is about 0.84. This means that there is a strong positive correlation between the two fields. In other words, this means that as engine size increases, weight also linearly increases.
Now let us see if this is true or not by looking at the scatterplot between the two fields.
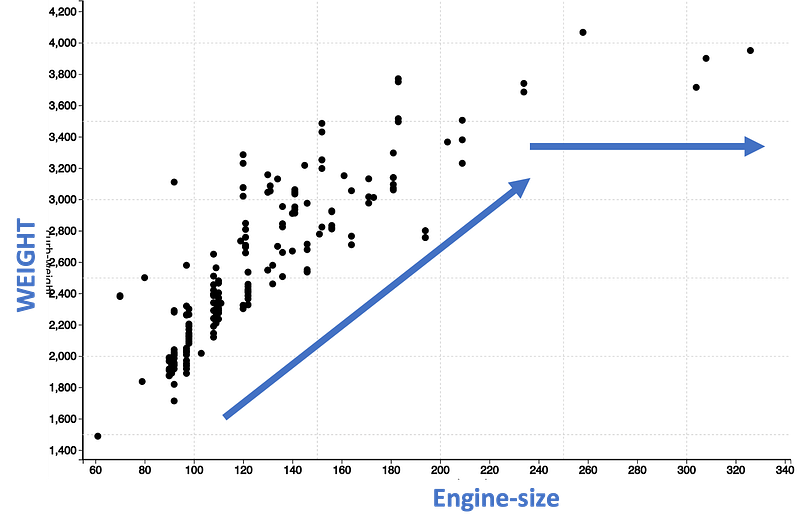
Just looking at these dots, we see that for engine size between 60 and 200, there is a linear increase in the weight. However, after an engine size of 200, the weight does not increase linearly but is leveling. So, this means that the relation between engine size and weight is not strictly linear.
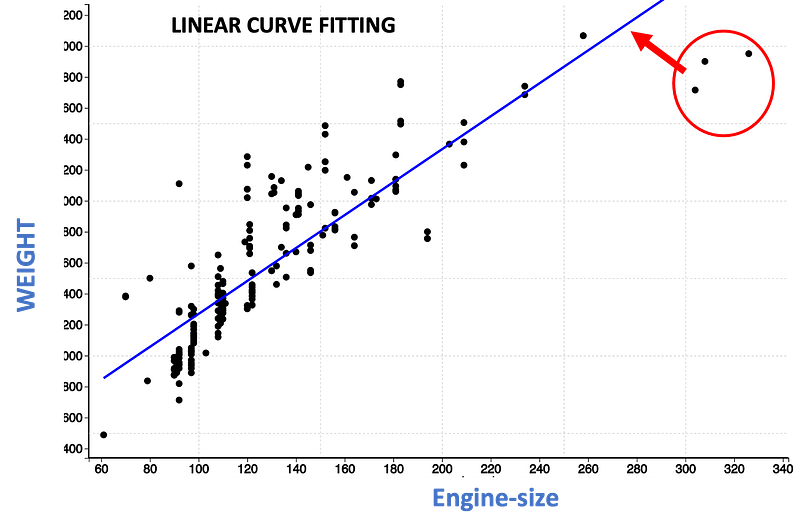
We can also confirm the non-linear nature by performing a linear curve fit as shown below with a blue line. You will observe that the points marked in the red circle are completely off the straight line indicating that a linear line does not correctly capture the pattern.
We started by looking at the color of the cell which indicated a strong correlation. However, we concluded that it is not true when we looked at the scatter plot. So where is the catch?
The problem is in the name of the technique. As it is titled a correlation matrix, we tend to use it to interpret all types of correlation. The technique is based on Pearson correlation, which is strictly measuring only linear correlation. So the more appropriate name of the technique should be linear correlation matrix.
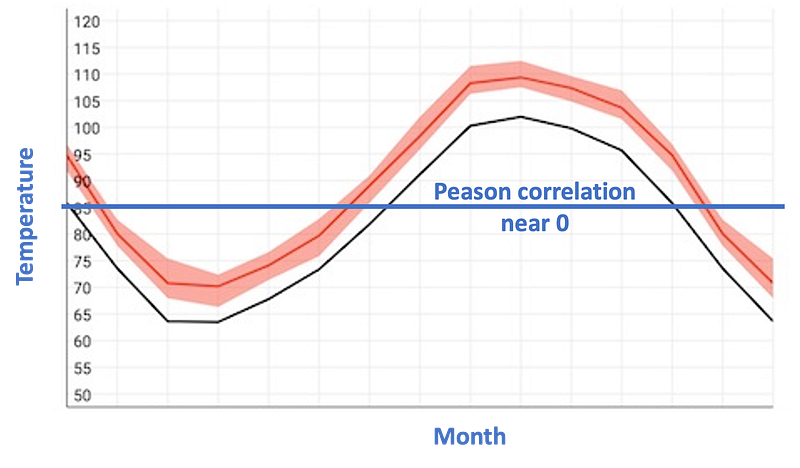
One of the other problems is that we might have missed out on some important patterns. If the correlation matrix does not indicate a strong correlation, generally it is not investigated. However, this could also indicate non-linear relation or pattern. For example, a correlation matrix would show no correlation between month and temperature. However, there is a strong relation between month and temperature.
Why do we really need a Non-Linear correlation matrix
By now you must have realized that correlations in data are always not strictly linear. In order to correctly represent relations in the data, we need a matrix that measures both linear as well as non-linear relations in the data.
So, say hello to a non-linear correlation matrix.
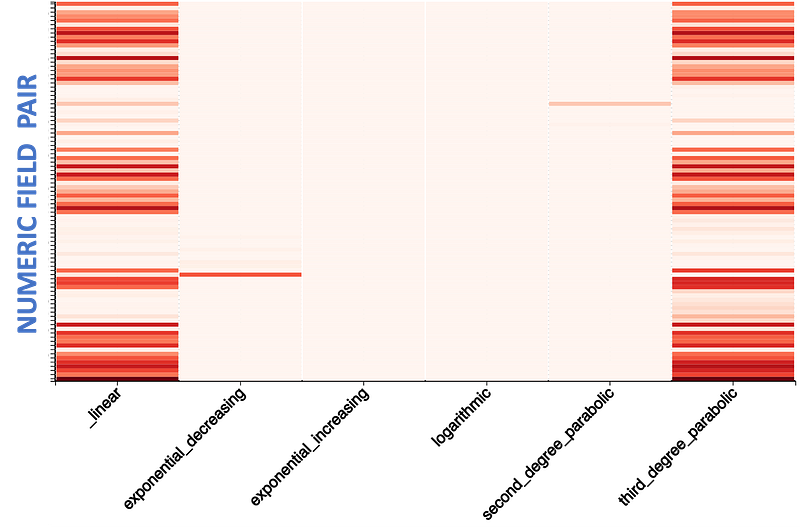
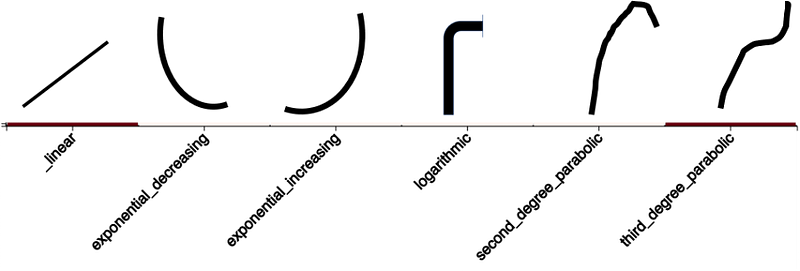
A non-linear correlation matrix has numeric field pairs on the Y-axis and the most common type of non-linear correlation on the X-axis. The different types of non-linear relation types commonly occurring are exponential decreasing, exponential increasing, logarithmic, second-degree parabolic, and third-degree parabolic. This list of non-linear relations is non-exhaustive, as there are other non-linear relations also. However, the most common ones are symbolically shown below.
Let us zoom into the matrix for the top 50 values.
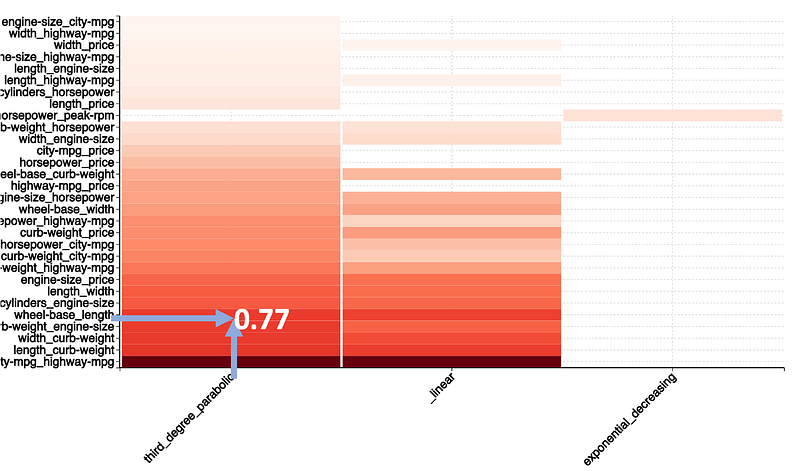
We can observe a strong third-degree non-linear correlation between engine size and weight. Let us confirm by performing a curve fitting.
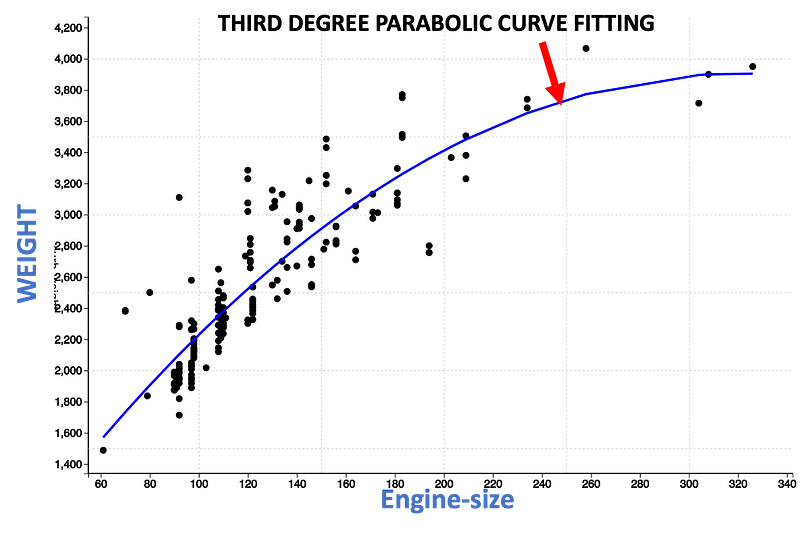
You can observe that the third degree curve fits better than the linear curve. This confirms the non-linear correlation between engine-size and the weight.
In conclusion, as a data scientists, we should move away from over dependence on linear correlation matrix. Understanding different non-linear patterns are key to correct interpretation of data. Non-linear correlation matrix is a good way to determine correlation in a more wholistic way.
Datasource citation
The data is from https://archive.ics.uci.edu/ml/datasets/automobile.
Dua, D. and Graff, C. (2019). UCI Machine Learning Repository [http://archive.ics.uci.edu/ml]. Irvine, CA: University of California, School of Information and Computer Science.
Additional resources
Website
You can visit my website to make non-correlation matrix as well as other analytics with zero coding. https://experiencedatascience.com
Please subscribe in order to stay informed whenever I release a new story.
You can also join Medium with my referral link
Youtube channel
Here is link to my YouTube channel https://www.youtube.com/c/DataScienceDemonstrated