
.Net Unit Testing and Coverage at ELMO Software

A note about ELMO’s software landscape: at ELMO we empower teams to make their own language / framework decisions. This means we have teams using a range of technologies such as PHP, Node, React, Java, as well as .Net. You name it and most likely one of our teams is using it :)
In ELMO Payroll we aim for 80% unit test coverage which seems intuitively like a sensible level, but does also lead to more questions. Why this level? Why not more? What does coverage actually mean? There is actually a lot of literature on code coverage so it is definitely a nuanced topic. One old but excellent resource is this set of white papers on code coverage.
Minimum Test Coverage
As explained in this paper on minimum test coverage, 100% code coverage is generally not cost effective
- Some test cases are expensive to reproduce but are highly improbable. The cost to benefit ratio does not justify repeating these tests simply to record the code coverage.
- There is often some amount of boilerplate code or one-statement functions that cannot entirely be excluded which brings down coverage a notch.
- Sometimes developers bend / break the YAGNI principle and implement a bit more than currently needed, maybe for the sake of completeness, or elegance of solution, or in order to not make coupling assumptions. In some such cases we may not want to be as exhaustive with test cases.
- We want to be slightly bias towards delivery over an absolute coverage metric at the higher end of the scale as it does become diminishing returns in that range.
For these reasons in ELMO Payroll our aim is to get to 80% coverage. This lets us prioritise the more important test cases and gives us some trade-off room.
Type of Coverage
What exactly does coverage entail? There are no shortage of types of coverage metric — statement coverage, decision coverage, condition coverage, path coverage, function coverage — just to name a few from this paper. We are somewhat at the mercy of code coverage measurement tools here, which are complex and not something we want to invent ourselves. Two popular coverage tools for .Net are coverlet and AltCover. These were intro-ed by Scott Hanselman here and here respectively. These tools mainly focus on two metrics:
- Line (statement) coverage: the statements of code visited during the test run / all code statements under test.
- Branch coverage: the possible condition branches through each unit of code / all possible condition branches
Our aim is to be at or above 80% for both of these metrics.
Type of Test
In our codebase we have three broad types of tests:
- Unit tests: testing each unit of code in memory with isolation from environmental and other dependencies
- Integration tests: testing units of code (from different layers) with environmental and other dependencies in tact
- End-to-end tests: testing the full system from outside the running process (e.g. by making requests, sending queue messages, interrogating the database for system state, etc). These are in fact bundled together with integration tests for convenience but are really another class of tests really.
Test coverage is possible with #1 and #2 but not with #3. This is because it’s a real system that we’re using in this case which would not generally be expected to capture coverage metrics.
In ELMO Payroll we only measure coverage on #1 because in our Jenkins pipeline we run unit tests in a separate stage from integration tests (unit tests are prior to deployment while integration tests occur after). If we need coverage over both stages then we have a few challenges:
- SonarQube integration can only occur within a single stage
- We have not explored if it’s possible to merge the coverage results from two separate test runs
The simpler approach is to select one of the two stages and sacrifice the other. We are still running both types, but only “taking credit” for coverage on one of them. So we can simply think of it as a handicap. As unit tests are more numerous and exhaustive we want with them for coverage measurement.
Tooling
Test coverage measurement is the result of a few different tools with different purposes:
- coverlet or AltCover: NuGet packages that actually perform the test coverage measurements while tests run. These tools have a few things in common — they both have a CLI, require PDBs to be generated, they hook into assemblies at the IL level and they generate XML files of coverage results. We have tried both these tools and have settled on AltCover. More on this below.
- OpenCover: is a classic test coverage tool and an XML file format. We don’t use the tool itself (it’s not .Net Core compatible) but we do use its file format. Both the above tools by default generate coverage results in OpenCover XML file format. This is a format that Sonarqube understands well
- SonarQube: is the reporting system where we collate all code analysis results. Our SonarQube project is configured with where to find OpenCover XML files and SonarQube seamlessly measures and displays the results therein.
- ReportGenerator: is a Nuget package which can eat up coverage XML files and generate detailed reports in various formats. We don’t directly need this since we have SonarQube but it is useful locally or for generating and displaying a coverage summary as part of the build pipeline.
- Fine Code Coverage: Visual Studio plugin that measures coverage and displays results within Visual Studio during development. This gives us somewhat different results to the above tools but gives us a good enough gauge while developing
The Problem with Coverlet
We started with Coverlet as it is mentioned more often in blog posts and articles and was straightforward to set up. It has good defaults so calling it is simply this:
dotnet test /p:CollectCoverage=true /p:CoverletOutputFormat=opencoverIt also outputs to the console a nice ASCII table for each project’s results as well as overall results such as:
+ — — — — — — — — — — — — — — — -+ — — — — + — — — — + — — — — +
| Module | Line | Branch | Method |
+ — — — — — — — — — — — — — — — -+ — — — — + — — — — + — — — — +
| Elmo.Pay.Infra.DatabaseAccess | 67.96% | 85% | 100% |
+ — — — — — — — — — — — — — — — -+ — — — — + — — — — + — — — — +
| Elmo.Pay.Domain.Interfaces | 100% | 100% | 100% |
+ — — — — — — — — — — — — — — — -+ — — — — + — — — — + — — — — +
| Elmo.Pay.Domain.Entities | 10.25% | 0% | 35.29% |
+ — — — — — — — — — — — — — — — -+ — — — — + — — — — + — — — — +
+ — — — — -+ — — — — + — — — — + — — — — +
| | Line | Branch | Method |
+ — — — — -+ — — — — + — — — — + — — — — +
| Total | 52.11% | 36.95% | 67.64% |
+ — — — — -+ — — — — + — — — — + — — — — +
| Average | 59.4% | 61.66% | 78.42% |
+ — — — — -+ — — — — + — — — — + — — — — +However, it has a major flaw. It does not seem to be able to handle multi-line statements very well. It seems to show up intermittently and does not seem to be well documented. Surprisingly this bug is not widely discussed and there is no guidance on how to resolve or work around this. We certainly don’t want to be forced to write all statements as a single line. Hence we turned to AltCover.
AltCover — the alternative
AltCover is a worthy replacement though its results are a little different to Coverlet. E.g. compare these two:
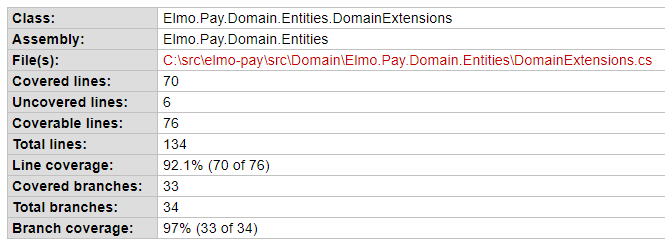
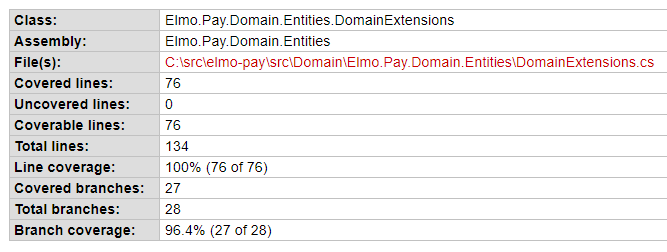
The line coverage difference is attributable to the bug in Coverlet but there is also a difference in what constitutes a “branch”. Without a deeper investigation it’s hard to tell which is more accurate in this area, but it probably doesn’t matter too much in the larger scheme of things.
Command Options
A drawback of AltCover is that it doesn’t have super intuitive defaults. A lot of command options need to be specified in order to get what we want. AltCover therefore needs to be called like this:
dotnet test /p:AltCover=true \
    /p:AltCoverForce=true \
    /p:AltCoverReport=coverage.opencover.xml \
    /p:AltCoverAssemblyExcludeFilter=Tests \
    /p:AltCoverAssemblyFilter=?Elmo.Pay \
    /p:AltCoverAttributeFilter=ExcludeFromCodeCoverage
    /p:AltCoverVerbosity=Warning
AltCoverAssemblyExcludeFilter allows us to exclude test projects, while AltCoverAssemblyFilter allows us to exclude Nuget packages (without this, it attempts to capture coverage for all package dependencies as well!). It also doesn’t by default recognize the ExcludeFromCodeCoverage attribute, which has to be provided in the AltCoverAttributeFilter option. The reason for AltCoverVerbosity is explained below.
These command options are described in more detail here and here.
Console Summary
Another issue we have with AltCover is that we don’t get a very useful summary output in the console. It looks like this for each test project:
A total of 1,307 visits recorded
Coverage statistics flushing took 0.11 seconds
Visited Classes 13 of 13 (100)
Visited Methods 16 of 19 (84.21)
Visited Points 99 of 108 (91.67)
Visited Branches 31 of 47 (65.96)
Maximum CRAP score 13
==== Alternative Results (includes all methods including those without corresponding source) ====
Alternative Visited Classes 15 of 18 (83.33
Alternative Visited Methods 22 of 31 (70.97)
Alternative maximum CRAP score 13These values seem to be lifted directly from the OpenCover XML file but don’t actually correspond to the coverage values generated by ReportGenerator or SonarQube. It feels like these are raw values of some sort which need consolidation or filtering. In any case, a summary output to the console that doesn’t match SonarQube is pretty much useless.
The workaround for this is to suppress this output (with the AltCoverVerbosity option) and to separately run ReportGenerator. We can call it to generate a TextSummary report and then cat that file to console in order to have the coverage summary reported. The report would look something like this:
Summary
  Generated on: 8/04/2021 - 1:35:36 AM
  Parser: MultiReportParser (4x OpenCoverParser)
  Assemblies: 7
  Classes: 21
  Files: 16
  Line coverage: 98.7%
  Covered lines: 564
  Uncovered lines: 7
  Coverable lines: 571
  Total lines: 1286
It’s more detailed than a summary but it is very useful output, especially for feature branches which that don’t go into SonarQube. ReportGenerator needs to be added as a local dotnet tool first and can then be called with dotnet:
dotnet new tool-manifest
dotnet tool install dotnet-reportgenerator-globaltool
dotnet reportgenerator "-reports:**\coverage.opencover.xml" "-targetdir:." "-reportTypes:TextSummary"
Method Coverage
Coverlet also gives us method coverage (only in the Console output) whereas AltCover doesn’t — though this is really not much of an issue as statement coverage and branch coverage are of more importance.
We hope this article has been helpful for you. If you have any questions or comments, please don’t hesitate to reach out.


