
SERIES ON THEORIES
Negative R2: Where Did You Go Wrong?
A statistical example
Recently, I went about a machine learning task and obtained a negative R2 scoring metric on my holdout test set.
“Wait! Isn’t R2… squared? Shouldn’t it be between 0 and 1? What on earth have I done?”
Initially, I was very concerned about the state of my machine learning task. After a couple minutes of googling, I remained only mildly concerned about the state of my machine learning task. In any case, I got a nice review of what a negative R2 value means and how it can accidentally be obtained. This article provides greater insight into the mathematical origins of the statistic to help elucidate the meaning of this result.
Receipt of a negative R2 value indicates that your model’s predicted values perform worse than if you were to use the average as a predicted value. Your own googling may yield similar statements. Here, I explain why with a data example.

Why use R2?
R2 is the Coefficient of Determination, the proportion of variation in the outcome explained by the input. It is frequently used as a performance metric in regression tasks predicting continuous outcomes.
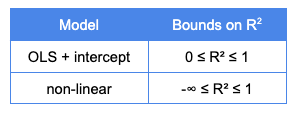
In classical linear regression, the values of R2 are bound between 0 and 1. This article provides a nice proof-based explanation as to why. However, the short version is that the proof holds for the ordinary least squares (OLS) modeling approach when including an intercept. If you use a non-linear model (as many of us in the data science community do), throw those constraints out the window. Now our Coefficient of Determination bounds change from negative infinity to 1.
In fact, there is some reasonable debate as to whether R2 should be used at all for non-linear models. The argument is based on the fact that R2 is not a routinely reliable predictor of model fit, which is demonstrated by Spiess & Neumeyer in a 2010 journal paper.
Incidentally, R2 is not inherently useful as a goodness-of-fit metric for OLS either, at least until the assumption of linearity is determined valid through assessment of model residuals.
In any case, while R2 should not be used as a sole performance metric, there is no denial that R2 can be useful to evaluate model performance in concert with other metrics, such as MAE (mean absolute error), MSE (mean square error), RMSE (root mean square error), or possibly adjusted R2.
What is R2?
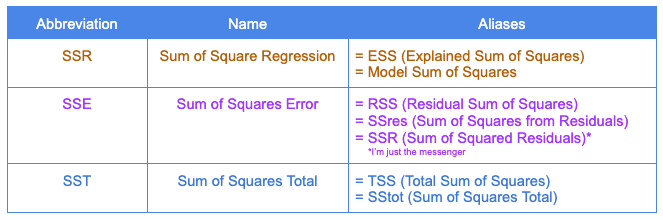
In classical regression, the goal is to predict an outcome. The variation of this outcome variable can be represented by 3 values: SSR, SSE, and SST. These are sums of squares of the variation in the sample. Squaring terms prevents us from having to deal with complications of negative values. The different aliases of SSR, SSE, and SST become particularly confusing, so please recognize I have done my best to compile some of the common alternate naming conventions in one place. Going forward, I will only be using the abbreviations from the left two columns in the table below.
In an OLS model, SSR + SSE = SST. Always.
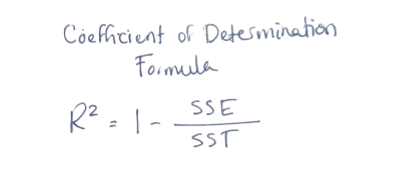
The reason these statistics are relevant is because the Coefficient of Determination is a function of SSE and SST.

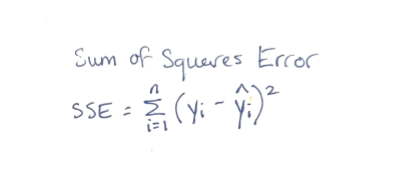
Using a sample of n observations, then we can calculate the purple SSE value as the sum of the squared differences between the true outcome (yᵢ) and the fitted/predicted outcome (ŷᵢ) for observation i.
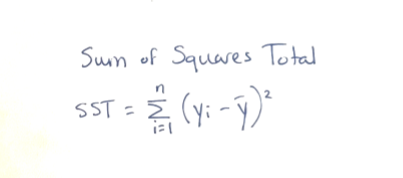
Using the n observations, we can also calculate the blue SST value as the sum of the squared differences between the true outcome (yᵢ) and the sample mean of the outcomes (ȳ).
After computing both SSE and SST, we can compute our desired metric, R2.
Negative R2 Example
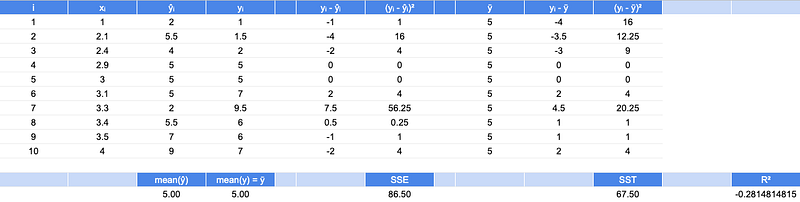
Let’s use a toy dataset of 10 observations. Each observation has a fitted / predicted estimate from a model, and each also has the true outcome, as shown in the table below. The actual model will not be provided for 2 reasons:
A) I made it up.
B) This performance metric can be applied to fitted values for virtually any model, so it is not relevant to the question of why R2 can take on negative values.
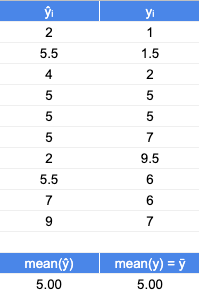
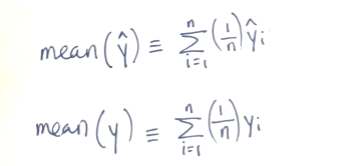
Note the mean of the fitted values and the mean of the true values are the same, 5. With the central tendencies being equal, perhaps this model is a reasonable predictor of the observations?
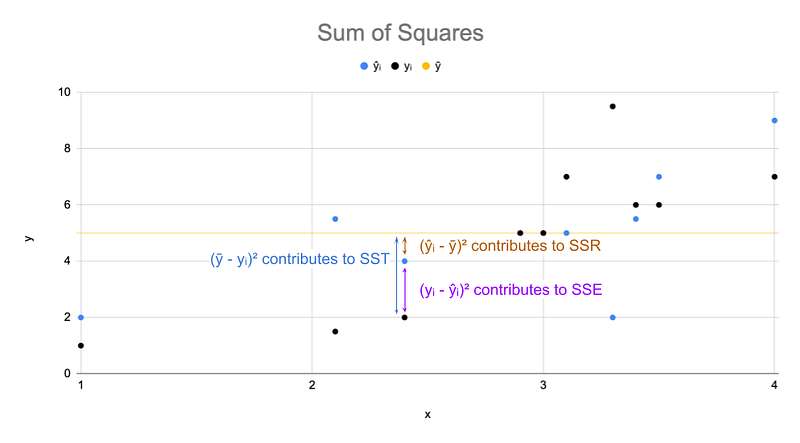
The values from the table are plotted below. Assume the black dots represent the true outcome values. The blue dots represent the predicted (aka fitted) values for the outcome from our model. The total variation of each observation can be partitioned as described. For clarity, only one observation is shown partitioned out in the figure below. The total variation (accounted for by SST) is partitioned into two quantities, the variation explained by the model fit (SSR) and the variation explained by the error in that fitted value (SSE).
For each metric, SSE and SST, there are differences and squares of those differences shown in corresponding columns. The SSE, sum of squares error, for the model is 86.5 while the SST, sum of squares total, is 67.5.
Because SST < SSE, that indicates that if we scrapped our model, and just predicted the mean true value (5.0) as the prediction statistic for each point, that estimate would perform better than our current model producing the fitted values. While that is not an ideal outcome, it means that this performance is not necessarily the result of a miscalculation. The reason R2 is bound between 0 and 1 for an OLS model with an intercept is that its intercept will take on the mean and its beta coefficient would take on a value of 0 if no better fit can be obtained.
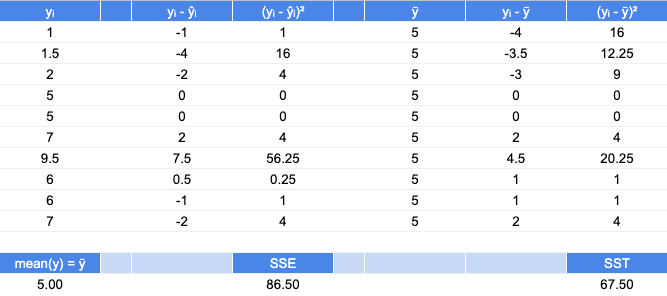
After calculating R2 from SSE and SST, we obtain a rounded R2 metric of -0.28, which is indeed negative because the model performance is less than the performance obtained using only the sample mean.
In summary, we have explained the origins of the coefficient of determination, a justification of why it can take on negative values in certain circumstances, and an example that shows the calculation for a toy dataset with the negative value.
If we return to my machine learning task that provided the previously worrisome negative R2 result, it seems that I need only be mildly concerned because my model does technically function… it’s just a terrible model. Well, better luck (to me) next time.
Comment below with any questions about other performance metrics or statistical quantities!
As always, keep on keeping on, despite any recent failures from negatively performing models.
“Failure is another stepping stone to greatness.” ― Oprah Winfrey
More from Kate Wall:


