
Notion on iPad and Mac
How to Update Notion Tables and Draw Charts With Apple Shortcuts
I work around Notion’s niggles to create a dashboard that’s easy to update using iPad or Mac

Life is getting expensive, so my strategy of blissfully ignoring energy consumption had to change. Time (sigh) to start keeping track of my energy bills (and everything else), and I needed to share that with my significant other too. She hates spreadsheets, and an attempt to simply provide her with a link to a shared folder caused morale issues.
Notion seemed to be worth trying as a potential way of collecting and sharing information in a way understandable to humans. Everybody seems to be talking about it and how great it is, but sadly for me, it didn’t offer an Apple Shortcuts extension.
Then I read about Nautomate in MacStories. Nautomate wraps up the Notion API as a library of Shortcuts actions. A potential migration to Notion was back on the cards.
It was eventually a win, but, my word, it was painful. Notion certainly isn’t a fully featured database system. However, after some head scratching and googling, I worked it out, and I can report that we have a functioning dashboard.
The dashboard is managed with Apple Shortcuts, which I’ve tested both on iPad and Mac. You don’t need Shortcuts to view the dashboard on Notion, so my other half is happy. Well, she’s prepared to use it. Let’s leave it at that.
I’m going to walk you through building a simplified example of what I did. Nothing is tricky. You just need to know where to look and what to do. Avoiding what not to do also matters.
You need these Shortcuts extensions:
- Nautomate, which at £10.49 per year or £1.29 a month.
- Charty, which offers basic functionality for free, and a once-only in-app purchase of £4.49 for premium features.
A full listing of the Shortcuts required with notes is included.
The bad old days
I like spreadsheets, and (for quite some time) Excel was my favourite program ever. Really. Do you know the adage,” if all you have is a hammer, everything looks like a nail”. It was a bit like that with me and Excel.
The result is that all our household information, including how much electricity we use and the amount of oil we burn, reside in spreadsheets. These sit on cloud storage, and I know where to find them and update them.
No one else does, however.
Even setting aside all that, there are issues. I have many files, all holding useful information, in silos. It would be cool to combine it all into one place and create a dashboard. What does the big picture look like?
I could link together spreadsheets, or (Easter Bunny forbid) create a massive monster spreadsheet, but there must be a better way.
The mission (simplified version)
For the purposes of this article, I’m going to show only one part of my dashboard. I will work through how I add electricity readings to Notion and then rebuild a chart showing usage. Everything else is just a variation on that.
The mission is therefore:
- Capturing new readings.
- Work out the change since last time.
- Store it and update the graph.
Simples. Or you’d think so.
Tools of the trade
Notion
Why Notion?
Everybody seems to be talking about and using it1 The number of Medium articles, YouTube videos, and intensity of user enthusiasm are hard to ignore. I gave up counting after I found 19 articles on Medium about Notion.
A cursory investigation impressed me. It has many ways to store and display information, including embedded databases. Dating had gone well, so perhaps it was time for a relationship.
Nautomate
Download Nautomate from the App Store and run it.
You then have to add Nautomate as an integration on Notion and make the relevant tables visible to the integration.
To add the Nautomate integration to Notion:
- Tap on the settings tab in the sidebar on Notion.
- Click on Integrations.
- Add a new one and call it, “Nautomate”.
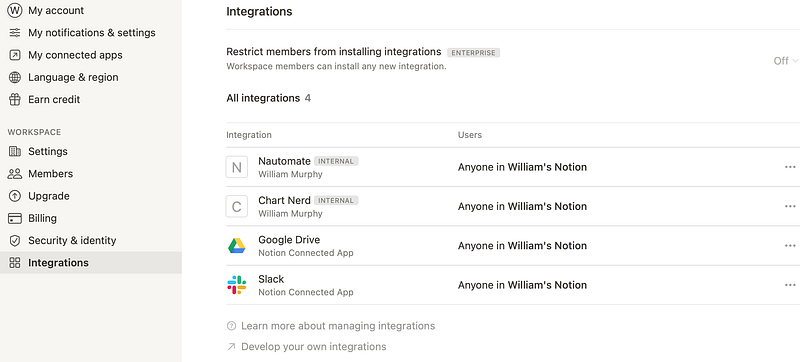
You’ll have to copy a token and paste it into Nautomate. This enables Nautomate to access your pages on Notion.
Charty
Download Charty from the App Store and run it.
Dashboard, attempt one
What, no charting?
I’ve learnt from bitter experience to avoid the big bang approach. Better to start with a toy version that proves techniques and then scale it up. To that end, I created a simple table called, “ElectricityToy”. Here it is:
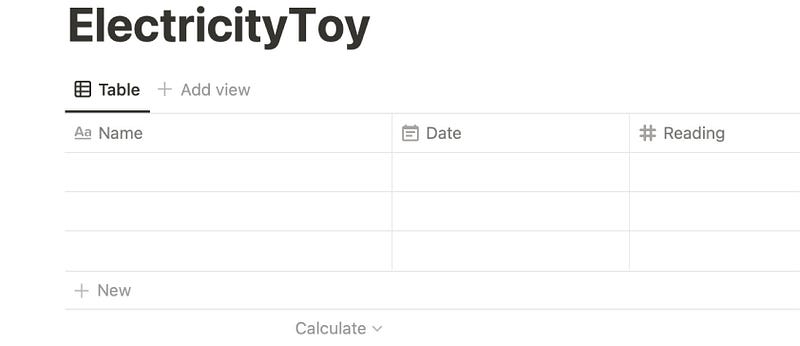
- Date is the date of a reading.
- Reading is the number from the metre in kWh.
I ignore the Name field, which appears to be compulsory in Notion databases/tables.
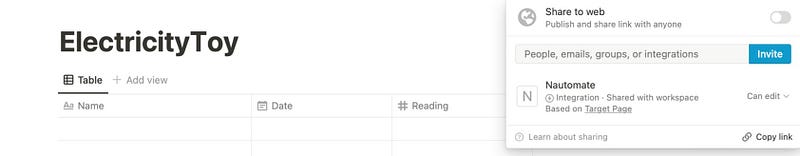
After you create the table, make it available to the Nautomate integration. It’s easy to do; just click or tap on the Share button.
I added in some dummy data and looked for the charting tools. There was nothing obvious, so I reached out to Doctor Google. Ah, there are no charting tools. You have to use a widget.
Really? None?
Okay, deep breath. Accept the things you can’t change, so I had a look at chart widgets. They all required subscriptions, and although I’m happy to pay for good work well done, it stuck in my throat to pay for something that should be part of Notion,
That’s when I remembered that I had bought a Shortcut extension ages ago called, Charty. It was only a few pounds, so I’d downloaded it to try it out., Now I finally had a use for it, and there is no subscription.
Charting issue resolved.
Tracking change
The most important part of doing this (to me) was to track how much more or less I’m using. It’s easy on a spreadsheet, You just copy and paste relative cell references. How do you do that with a database?
It’s trickier than you might think. In a spreadsheet, the previous record is the previous row (or column). The order in a database table depends on the field you sort on. Despite that, I looked for some sort of relative addressing between rows in a Notion table, but unsurprisingly, you can’t do it.
How then to calculate the change since the previous reading? I settled for including an extra field, PreviousReading. This is populated when a new reading is added. It’s easy then to calculate the difference, and Notion tables can include calculated fields.
Those familiar with Notion tables, are sniggering as they read this.
Downloading un-calculated data doesn’t work
Blissful in my ignorance, I added the new property to ElectricityToy. I also added a calculated field, Usage. To create my chart, all I had to do was download the records and plot usage. Job done.
Except that it didn’t work. Even though I downloaded entire records, Nautomate could not find a Usage field!
I had created and deleted a few fields, so my first theory was that I was picking up cached table information. I restarted Nautomate (and the iPad), but no dice.
A glance at the record that came down provided that Nautomate was right. Usage wasn’t there. Long story, short, Notion doesn’t store calculated values. It works them out when a table is about to be displayed! I was attempting to download data that didn’t exist.
Usage needed to be a number property, not a calculated property. It has to be calculated when a record is added, ElectricityToy now looked like this:
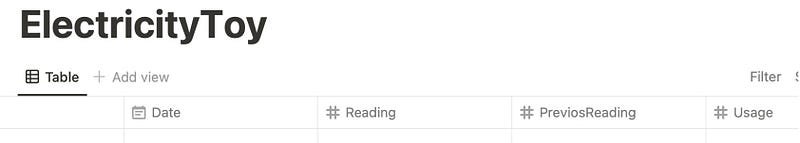
Ironically, that meant there was no need to store the previous reading in the new record! The PreviousReading field disappears.
I added some dummy data, and Nautomate downloaded everything (unsurprisingly). Once more, I need to learn to not make assumptions. How fallible of me…
Drawing charts
Nautomate can convert downloaded table data into CSV format, which is handy because Charty can readily process that. You tell it which properties to use for the x-axis and the y-axis, and it creates the graph.
The next challenge was to figure out what to do with the graph. Charty lets you export it into a bit map, which I assumed that I’d just add to a Notion page of my choice. There’s another one of those assumptions that’s served me so well!
Notion doesn’t store media files, only URLs pointing at them. Luckily, Charty help documentation made reference to “upload imgurg”. I had never heard of it, but it’s a standard Shortcut command. Apparently, you can store media there. I did, and it worked.
I added the imgurg URL to a Notion page, and, behold, a chart! Performance isn’t always great, but it is a free site, and that gives you little scope for complaints.
The Shortcut
Here is the complete Shortcut. It assumes that the ElectricityToy table exists and that Nautomate can edit it. It also assumes there is at least one record in the table.
The gist of it:
- Retrieve the previous reading from the database.
- Ask the user for the latest reading.
- Calculate the usage and store it.
- Delete the old chart from its page and draw a new one.
Capturing new readings
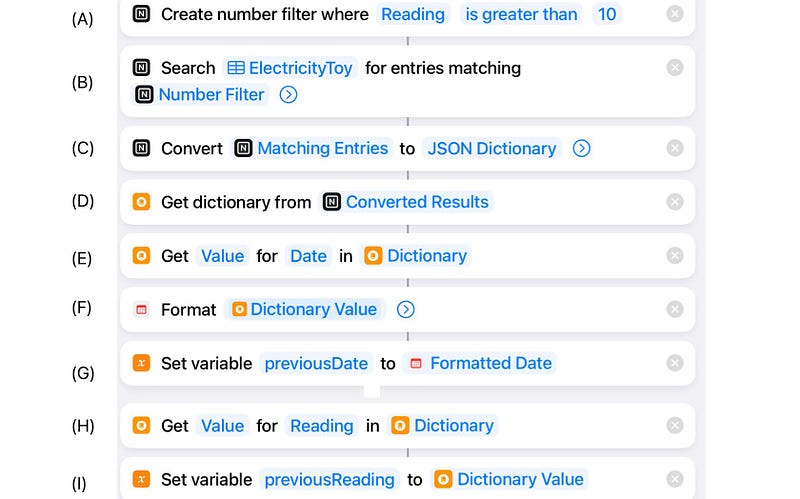
You retrieve values from Notion using a filter (steps A,B). Field values can be accessed using a dictionary (C, D).
The keys in the dictionary match the database field names, and they are case-sensitive (E,H). It’s a good idea to put the values into named variables (G,I) because it gets confusing quickly if you don’t.
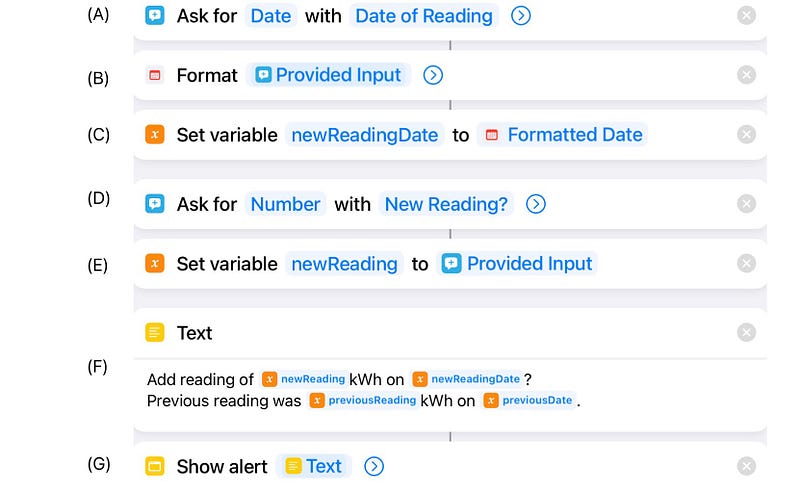
Asking the user for a new reading and date is fairly straightforward (A → E). I summarise everything in step F and display an alert, G. If the user selects cancel within the alert, then the Shortcut stops.
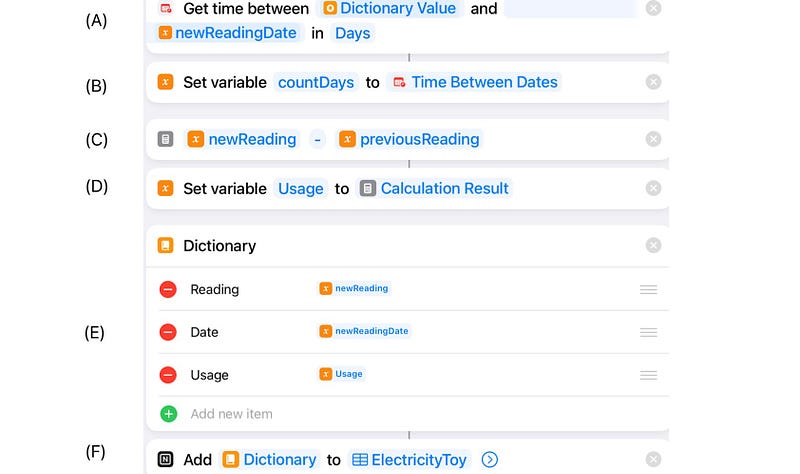
Now it’s just a case of subtracting the previous reading from the new one to calculate the usage (step C). I left in a line to show how to calculate the difference between two dates (A), but I don’t use it.
Store everything in the database using another dictionary (E, F).
Updating the graph on Notion
This is the main Shortcut to run to capture a new reading and refresh the chart on Notion.
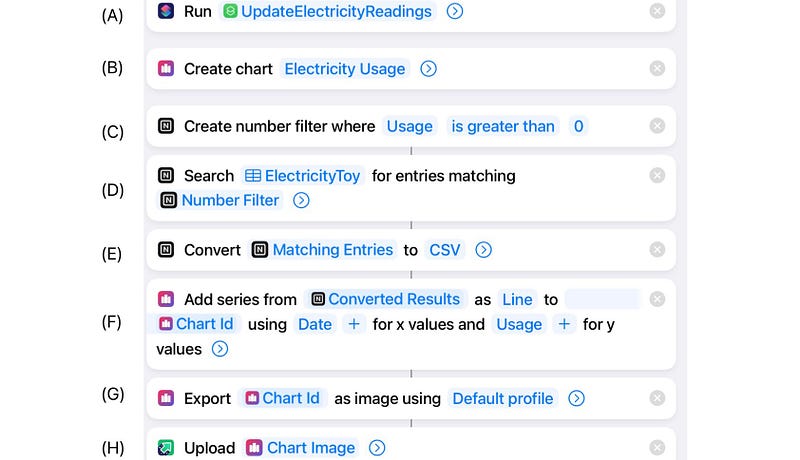
The first line (A) calls the previous shortcut to capture the new reading. When you run this, you’ll have to give permission. Choose Always Allow.
The next step is to retrieve the readings from Notion to create the chart (A to D). Instead of converting them into a dictionary, you need them in CSV format (E).
Add the data to the chart (F) and then export the chart as a bitmap (G). You then upload it to imgur (H). (Search for “upload to imgur”, in Shortcuts.) This returns a URL.
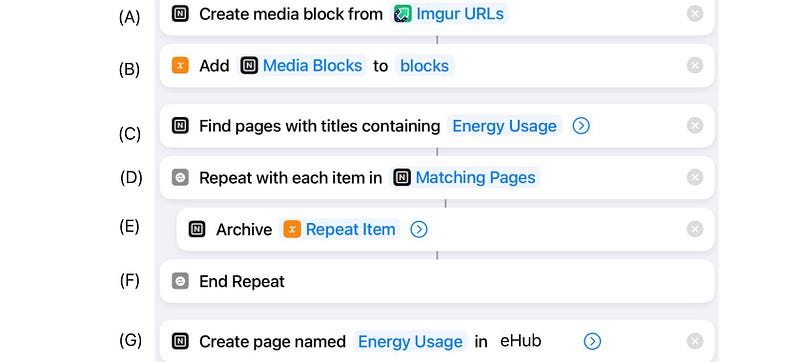
Notion builds pages using blocks, so create a block for the chart (A) and add it to a variable (B).
I then find the page on which I’m displaying the chart (step C), and delete it (E). I create a replacement page with the new graph (G).
On the Mac too
The Snortcuts work without modification on the Mac if Nautomate and Charty are installed.
Notion doesn’t like iPad
Modern iPadOS is supposed to boast a fully featured Safari browser, but not every Notion feature on Mac Safari exists on the iPad version. The one that hurt the most was CSV import.
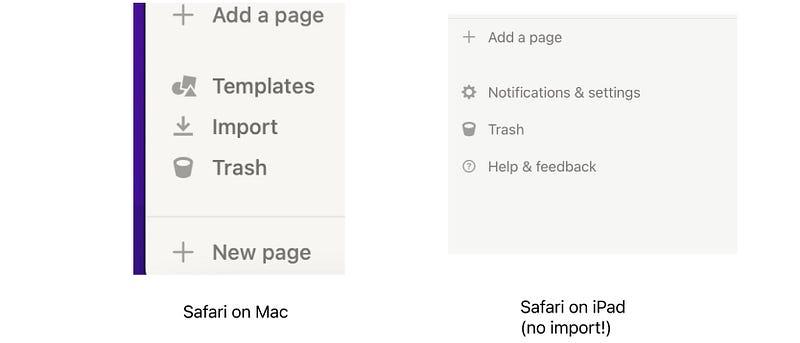
That’s an important feature for anyone migrating data on to Notion, and I just can’t see why it’s missing on iPadOS. Perhaps it’s hidden somewhere else in the user interface?
Next steps
ElectricityToy proved the techniques needed to create my reporting system. I’m in the process of creating more tables and charts, wondering what lurks behind the next corner.
I’m not impressed by Notion’s database solution. There are gaps, which third parties are filling, but I think basic functionality should be there. It feels like it evolved rather being designed.
Perhaps I’m missing something big, but meanwhile this works, and I have a solution that I can build on.
Read more of my articles on Apple Shortcuts:


