
Multi-Column Pivots in PySpark
This example is implemented using PySpark, but the concept works with ANSI SQL, too.
Data Engineers and Analysts often need help with structuring data. Data Engineers typically prefer a row-oriented approach for its efficiency in storage and processing. On the other hand, Data Analysts, who extract insights and trends, favor a column-oriented layout that lends itself to easier analysis and visualization.

Let’s create sample data with our F*R*I*E*N*D*S cast :)
from pyspark.sql.functions import concat_ws, col, first
from pyspark.sql.types import StructType, StructField, StringType, IntegerType

# Sample data
data = [
    (1, "Ross", "Geller", "Fall94", "Mathematics", 93),
    (2, "Monica", "Geller", "Fall94", "Mathematics", 99),
    (3, "Rachel", "Green", "Fall94", "Mathematics", 87),
    (4, "Joey", "Tribbiani", "Fall94", "Mathematics", 73),
    (5, "Chandler", "Bing", "Fall94", "Mathematics", 82),
    (6, "Phoebe", "Buffay", "Fall94", "Mathematics", 87),
    (1, "Ross", "Geller", "Spring95", "CS101", 90),
    (2, "Monica", "Geller", "Spring95", "CS101", 89),
    (3, "Rachel", "Green", "Spring95", "CS101", 95),
    (4, "Joey", "Tribbiani", "Spring95", "CS101", 83),
    (5, "Chandler", "Bing", "Spring95", "CS101", 93),
    (6, "Phoebe", "Buffay", "Spring95", "CS101", 89),
    (1, "Ross", "Geller", "Fall95", "Science", 90),
    (2, "Monica", "Geller", "Fall95", "Science", 99),
    (3, "Rachel", "Green", "Fall95", "Science", 87),
    (4, "Joey", "Tribbiani", "Fall95", "Science", 78),
    (5, "Chandler", "Bing", "Fall95", "Science", 85),
    (6, "Phoebe", "Buffay", "Fall95", "Science", 89)
]

# Schema for the above data
schema = StructType([
    StructField("id", IntegerType(), True),
    StructField("fname", StringType(), True),
    StructField("lname", StringType(), True),
    StructField("semester", StringType(), True),
    StructField("course", StringType(), True),
    StructField("grade", IntegerType(), True)
])


# Create the DataFrame
df = spark.createDataFrame(data, schema=schema)
display(df)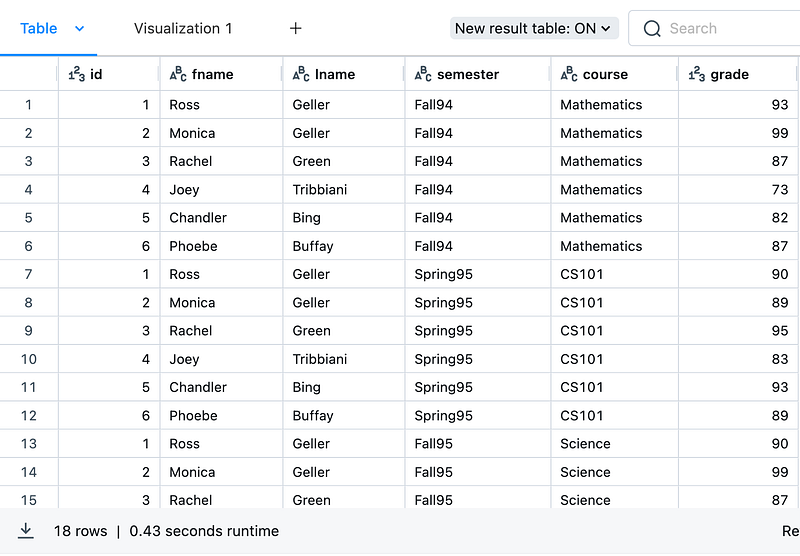
Now, it's time to pivot the semester and course so that analysts can use them for their analysis.
# Create a new column combining semester and course for easier pivoting
df1 = (df.withColumn("semester_course", concat_ws("_", col("semester"), col("course")))
        .withColumn("name", concat_ws(" ", col("fname"), col("lname")))
      )
# Pivot based on the new column
pivot_df = (df1.groupBy("id", "name")
                .pivot("semester_course")
                .agg(first("grade"))
                .orderBy("id")
           )

display(pivot_df)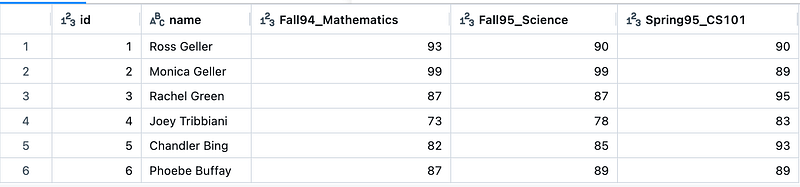
Advantages of Pivoting
- A smaller number of rows makes it faster to load and visualize. In the above example, 18 rows have been transformed to 6 rows.
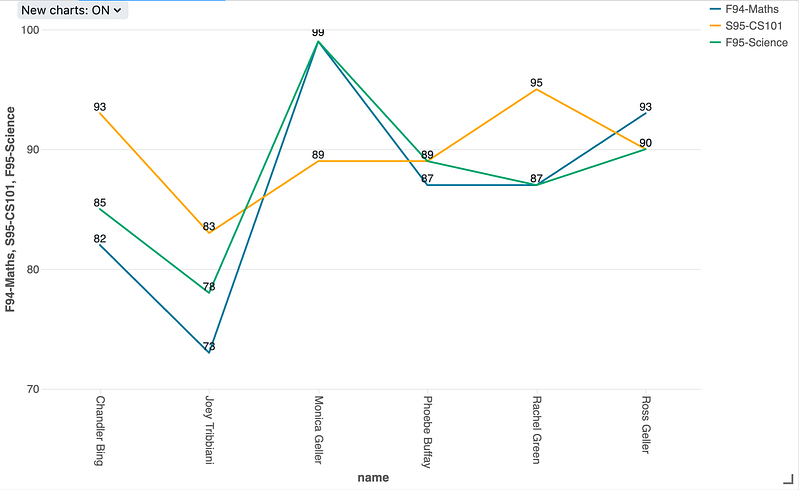
- With data in a pivoted format, comparing data side-by-side is much easier. BI tools can highlight the trends/outliers and patterns that might not be evident in a row-by-row approach.
- By organizing data into a matrix-like structure, pivoting makes efficient use of space in visual representations.
I tried to do a quick visualization using Databricks Charts,
If you like the article, remember to clap as many times as you can and leave feedback on how this helps in your use case(s).