
A Comprehensive Guide to Enabling Fluent Bit Logging in Amazon EKS with CloudWatch Insights (Part 12/13)
Discover how AWS CloudWatch Container Insights for Amazon EKS offers deep insights into Kubernetes clusters, ensuring optimal performance, reliability, and security.
In the rapidly evolving world of cloud computing, Kubernetes has become the go-to orchestration tool for managing containerized applications efficiently. Amazon Elastic Kubernetes Service (EKS) simplifies the process of building, securing, operating, and maintaining Kubernetes clusters in the cloud.
However, as with any complex system, effective monitoring and management are crucial to ensuring optimal performance and reliability. Enter AWS CloudWatch Container Insights, a powerful tool designed to give developers and system administrators deep insights into their Amazon EKS clusters.
Let’s dive into how CloudWatch Container Insights enhances Kubernetes clusters management and ensures a seamless operational experience. 📊🌐
Introduction to Fluent Bit and CloudWatch Container Insights🌟
Fluent Bit is an open-source log processor and forwarder, part of the Fluentd ecosystem, designed for high performance and minimal resource consumption. It supports multiple inputs, outputs, and filters, making it highly versatile for log processing and aggregation.
AWS CloudWatch Container Insights is a monitoring service that automatically collects, aggregates, and summarizes metrics and logs from your containerized applications and microservices. For Amazon EKS, it provides detailed insights into Kubernetes namespaces, pods, deployments, and nodes.
AWS provides a Fluent Bit image optimized for use with AWS services, including CloudWatch Logs, Amazon Kinesis, and Amazon Elasticsearch Service. This makes it easier to integrate your logging infrastructure with other AWS services.
Combining Fluent Bit with CloudWatch Container Insights enables you to efficiently collect, filter, and forward logs from your Kubernetes clusters to CloudWatch, providing a comprehensive monitoring solution that leverages the strengths of both services.
Key Features of CloudWatch Container Insights 🔍
- Performance Monitoring: Track CPU, memory, disk, and network utilization metrics in real time.
- Logs Management: Automatically collect, aggregate, and store container logs for troubleshooting and analysis.
- Alerts and Alarms: Set up custom alarms based on specific metrics to get notified about potential issues before they impact your applications.
- Service Map: Visualize the relationships and dependencies between services running in your clusters, helping you understand the architecture and flow of applications.
Benefits of Using CloudWatch Container Insights 🌈
- Enhanced Visibility: Gain comprehensive insights into the performance and health of your Kubernetes clusters, helping you identify and resolve issues promptly.
- Proactive Troubleshooting: With detailed logs and metrics, pinpoint the root causes of issues faster, reducing downtime and improving user experience.
- Optimized Resource Utilization: Monitor and analyze resource utilization to make informed decisions about scaling and optimizing your clusters for cost-effectiveness and efficiency.
- Improved Security Posture: Collect and analyze log data to detect suspicious activities and vulnerabilities, enhancing the security of your containerized applications.
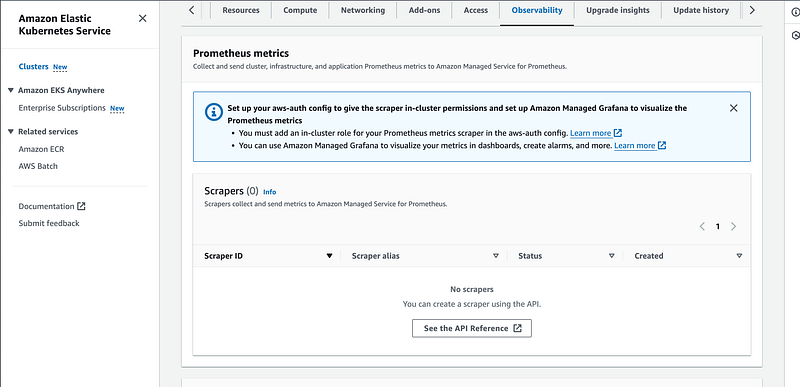
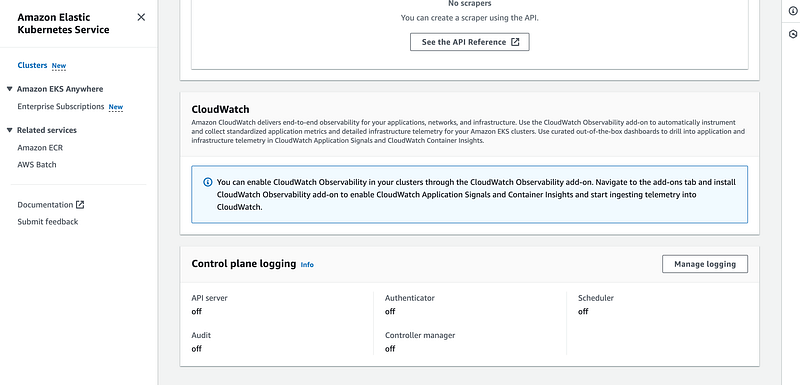
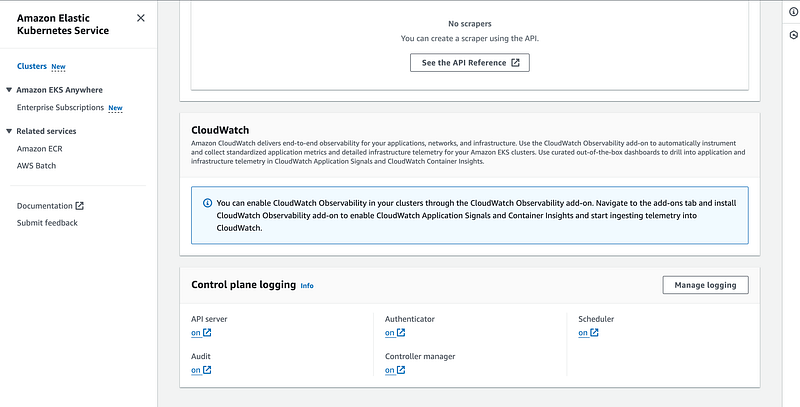
There are 2 types of logging.
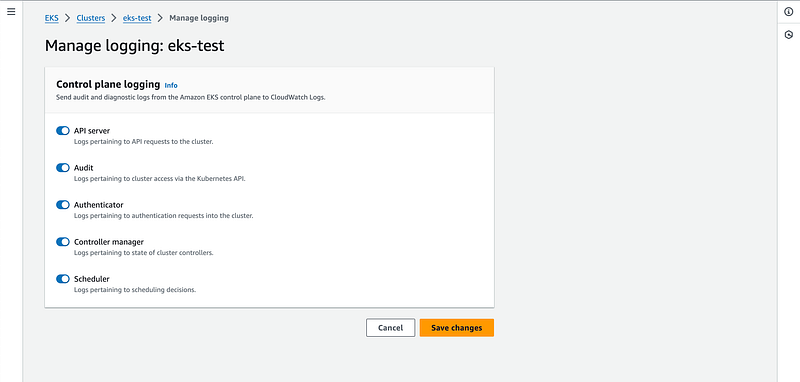
1. Control plane logging
Control plane logging is a crucial aspect of managing and securing Kubernetes clusters. It involves collecting and analyzing logs generated by the various components of the Kubernetes control plane.
These components include the Kubernetes API server, etcd, controller manager, and scheduler. By monitoring these logs, administrators can gain insights into the operational status of the cluster, debug issues, detect anomalies, and enhance security.
2. Node and pod level Logging
Setting Up Fluent Bit with CloudWatch Container Insights for Amazon EKS
Prerequisites
- An active Amazon EKS cluster.
- Proper IAM roles and permissions for accessing CloudWatch and managing EKS.
kubectlandawsCLI tools configured for your cluster and AWS account.- You are running a cluster that supports Kubernetes version 1.18 or higher. This is a requirement of Container Insights for EKS Fargate. You have also defined a Fargate profile to schedule pods on Fargate.
- The AWS Identity and Access Management (IAM) managed CloudWatchAgentServerPolicy is in place to enable your Amazon EKS worker nodes to send metrics and logs to CloudWatch. You can do this by attaching a policy to the IAM role of your worker nodes. Or, use an IAM role for service accounts for the cluster, and attach the policy to this role. For more information, see IAM roles for service accounts.
Stream container logs running in your EKS EC2 cluster:
A. By using fluent bit:
Step 1: Deploy Fluent Bit on Amazon EKS
Deploy Fluent Bit as a DaemonSet to ensure it runs on every node in your EKS cluster, collecting logs from all containers.
- Create a Fluent Bit Configuration: Define a
ConfigMapwith the Fluent Bit configuration. This should include input plugins for tailing container logs, filters for processing logs (if necessary), and an output plugin configured to send logs to AWS CloudWatch. - Deploy Fluent Bit DaemonSet: Use the Fluent Bit Kubernetes DaemonSet YAML file to deploy Fluent Bit. Ensure the DaemonSet is configured to use the
ConfigMapcreated in the previous step.
Use below command to configure the fluent bit and sen the logs to amazon cloudwatch logs.
Add the cluster name and region.
ClusterName=<Cluster-Name>
LogRegion=<Region>
FluentBitHttpPort='2020'
FluentBitReadFromHead='Off'
[[ ${FluentBitReadFromHead} = 'On' ]] && FluentBitReadFromTail='Off'|| FluentBitReadFromTail='On'
[[ -z ${FluentBitHttpPort} ]] && FluentBitHttpServer='Off' || FluentBitHttpServer='On'
curl https://raw.githubusercontent.com/aws-samples/amazon-cloudwatch-container-insights/latest/k8s-deployment-manifest-templates/deployment-mode/daemonset/container-insights-monitoring/quickstart/cwagent-fluent-bit-quickstart-enhanced.yaml | sed 's/{{cluster_name}}/'${ClusterName}'/;s/{{region_name}}/'${LogRegion}'/;s/{{http_server_toggle}}/"'${FluentBitHttpServer}'"/;s/{{http_server_port}}/"'${FluentBitHttpPort}'"/;s/{{read_from_head}}/"'${FluentBitReadFromHead}'"/;s/{{read_from_tail}}/"'${FluentBitReadFromTail}'"/' | kubectl apply -f -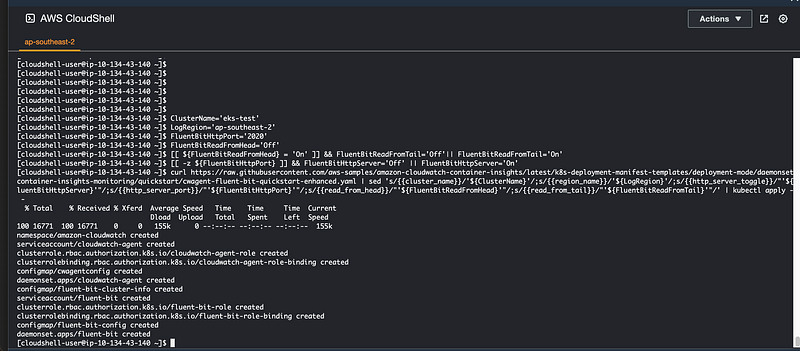
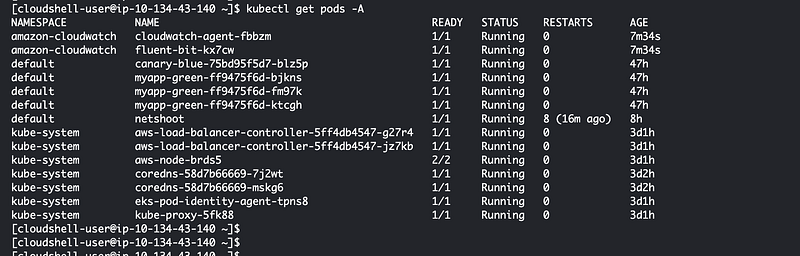
kubectl get pods -A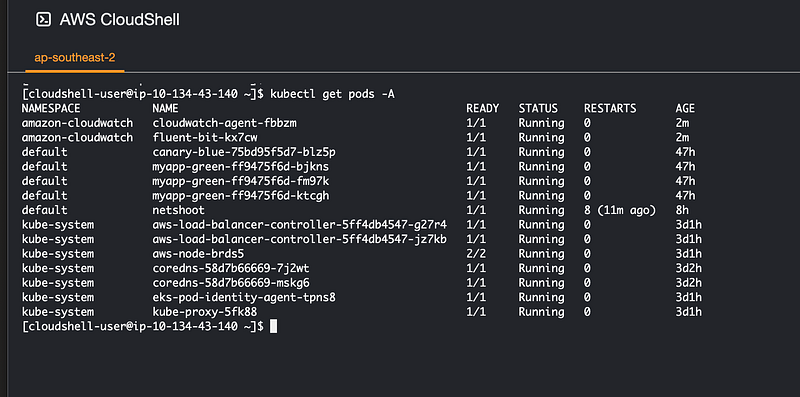
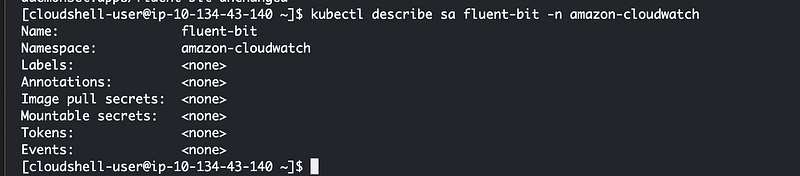
As you can see in the above screen shot we are using the existing role associated with node if you want to create separate role which is a best practice then we have to annotate the service account created for fluent-bit.
kubectl annotate serviceaccounts fluent-bit -n amazon-cloudwatch "eks.amazonaws.com/role-arn=arn:aws:iam::1234567890:role/<role-name>"Step 2 : Verify and Monitor Logs
Once Fluent Bit is deployed and configured:
- Verify Fluent Bit Pods: Ensure Fluent Bit pods are running on all nodes by checking their status with
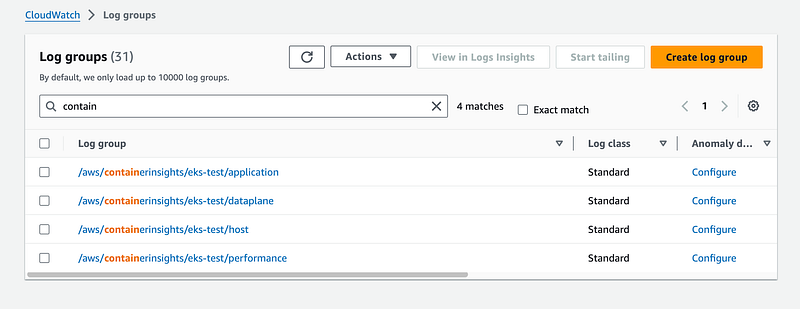
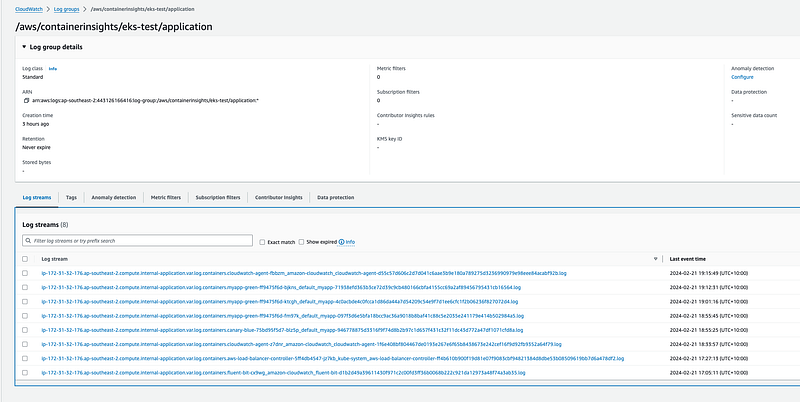
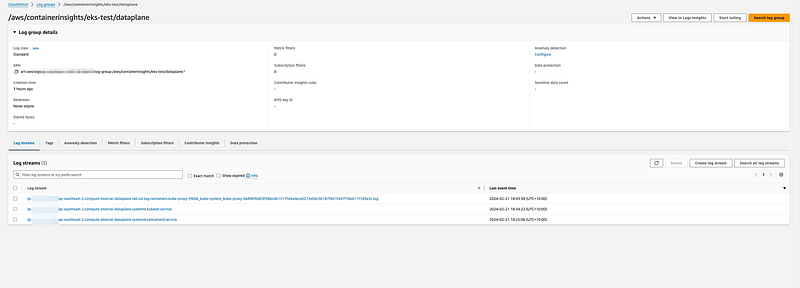
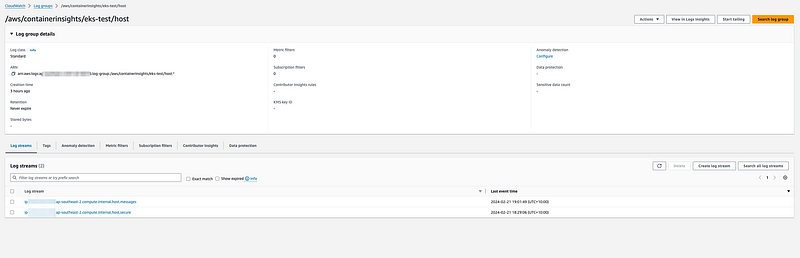
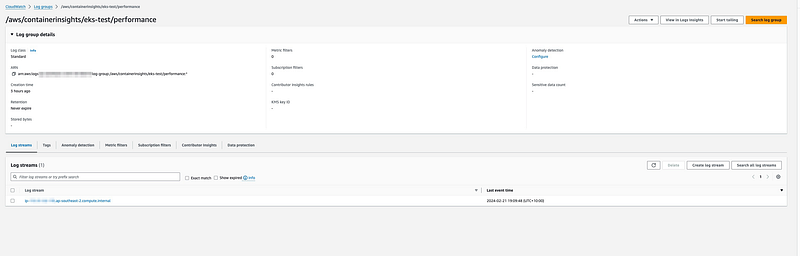
kubectl. - Check CloudWatch Logs: Go to the AWS CloudWatch console, navigate to Logs, and find your Log Group. You should see the logs being streamed from your EKS cluster.
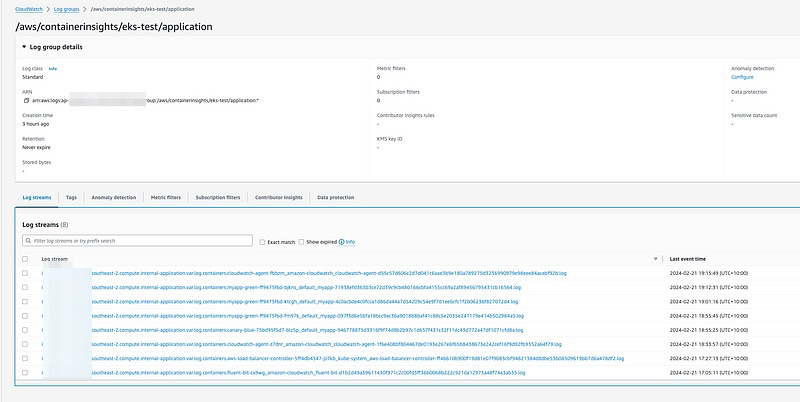
With the fluent bit it gives us flexibility to send the logs to datadog or splunk etc as per your requirement by making changes in the manifest file. Also can make changes in the input as well based on your requiremnts of which logs you want to monitor.
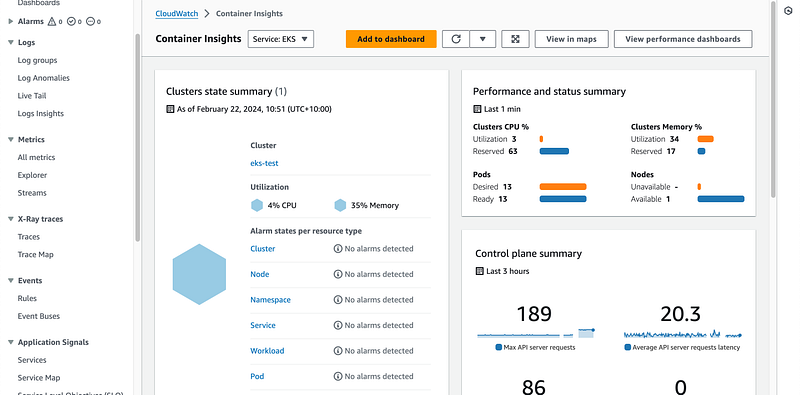
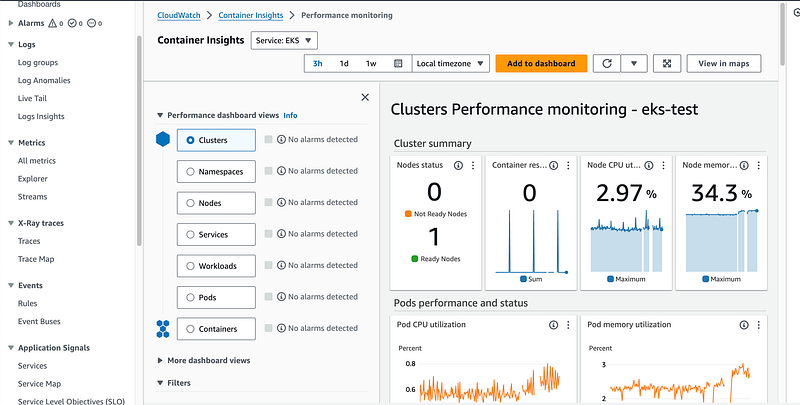
Monitoring of EKS cluster and pods can be done from AWS cloudwatch dashboard.
# create amazon-cloudwatch namespace
apiVersion: v1
kind: Namespace
metadata:
name: amazon-cloudwatch
labels:
name: amazon-cloudwatch
---
# create cwagent service account and role binding
apiVersion: v1
kind: ServiceAccount
metadata:
name: cloudwatch-agent
namespace: amazon-cloudwatch
---
kind: ClusterRole
apiVersion: rbac.authorization.k8s.io/v1
metadata:
name: cloudwatch-agent-role
rules:
- apiGroups: [""]
resources: ["pods", "nodes", "endpoints"]
verbs: ["list", "watch"]
- apiGroups: ["apps"]
resources: ["replicasets", "daemonsets", "deployments", "statefulsets"]
verbs: ["list", "watch"]
- apiGroups: ["batch"]
resources: ["jobs"]
verbs: ["list", "watch"]
- apiGroups: [""]
resources: ["nodes/proxy"]
verbs: ["get"]
- apiGroups: [""]
resources: ["nodes/stats", "configmaps", "events"]
verbs: ["create"]
- apiGroups: [""]
resources: ["configmaps"]
resourceNames: ["cwagent-clusterleader"]
verbs: ["get","update"]
- nonResourceURLs: ["/metrics"]
verbs: ["get", "list", "watch"]
---
kind: ClusterRoleBinding
apiVersion: rbac.authorization.k8s.io/v1
metadata:
name: cloudwatch-agent-role-binding
subjects:
- kind: ServiceAccount
name: cloudwatch-agent
namespace: amazon-cloudwatch
roleRef:
kind: ClusterRole
name: cloudwatch-agent-role
apiGroup: rbac.authorization.k8s.io
---
# create configmap for cwagent config
apiVersion: v1
data:
# Configuration is in Json format. No matter what configure change you make,
# please keep the Json blob valid.
cwagentconfig.json: |
{
"agent": {
"region": "{{region_name}}"
},
"logs": {
"metrics_collected": {
"kubernetes": {
"cluster_name": "{{cluster_name}}",
"metrics_collection_interval": 60,
"enhanced_container_insights": true
}
},
"force_flush_interval": 5
}
}
kind: ConfigMap
metadata:
name: cwagentconfig
namespace: amazon-cloudwatch
---
# deploy cwagent as daemonset
apiVersion: apps/v1
kind: DaemonSet
metadata:
name: cloudwatch-agent
namespace: amazon-cloudwatch
spec:
selector:
matchLabels:
name: cloudwatch-agent
template:
metadata:
labels:
name: cloudwatch-agent
spec:
containers:
- name: cloudwatch-agent
image: public.ecr.aws/cloudwatch-agent/cloudwatch-agent:1.300032.3b392
#ports:
# - containerPort: 8125
# hostPort: 8125
# protocol: UDP
resources:
limits:
cpu: 400m
memory: 400Mi
requests:
cpu: 400m
memory: 400Mi
# Please don't change below envs
env:
- name: HOST_IP
valueFrom:
fieldRef:
fieldPath: status.hostIP
- name: HOST_NAME
valueFrom:
fieldRef:
fieldPath: spec.nodeName
- name: K8S_NAMESPACE
valueFrom:
fieldRef:
fieldPath: metadata.namespace
- name: CI_VERSION
value: "k8s/1.3.20"
# Please don't change the mountPath
volumeMounts:
- name: cwagentconfig
mountPath: /etc/cwagentconfig
- name: rootfs
mountPath: /rootfs
readOnly: true
- name: dockersock
mountPath: /var/run/docker.sock
readOnly: true
- name: varlibdocker
mountPath: /var/lib/docker
readOnly: true
- name: containerdsock
mountPath: /run/containerd/containerd.sock
readOnly: true
- name: sys
mountPath: /sys
readOnly: true
- name: devdisk
mountPath: /dev/disk
readOnly: true
nodeSelector:
kubernetes.io/os: linux
volumes:
- name: cwagentconfig
configMap:
name: cwagentconfig
- name: rootfs
hostPath:
path: /
- name: dockersock
hostPath:
path: /var/run/docker.sock
- name: varlibdocker
hostPath:
path: /var/lib/docker
- name: containerdsock
hostPath:
path: /run/containerd/containerd.sock
- name: sys
hostPath:
path: /sys
- name: devdisk
hostPath:
path: /dev/disk/
terminationGracePeriodSeconds: 60
serviceAccountName: cloudwatch-agent
---
# create configmap for cluster name and aws region for CloudWatch Logs
# need to replace the placeholders {{cluster_name}} and {{region_name}}
# and need to replace {{http_server_toggle}} and {{http_server_port}}
# and need to replace {{read_from_head}} and {{read_from_tail}}
apiVersion: v1
data:
cluster.name: {{cluster_name}}
logs.region: {{region_name}}
http.server: {{http_server_toggle}}
http.port: {{http_server_port}}
read.head: {{read_from_head}}
read.tail: {{read_from_tail}}
kind: ConfigMap
metadata:
name: fluent-bit-cluster-info
namespace: amazon-cloudwatch
---
apiVersion: v1
kind: ServiceAccount
metadata:
name: fluent-bit
namespace: amazon-cloudwatch
---
apiVersion: rbac.authorization.k8s.io/v1
kind: ClusterRole
metadata:
name: fluent-bit-role
rules:
- nonResourceURLs:
- /metrics
verbs:
- get
- apiGroups: [""]
resources:
- namespaces
- pods
- pods/logs
- nodes
- nodes/proxy
verbs: ["get", "list", "watch"]
---
apiVersion: rbac.authorization.k8s.io/v1
kind: ClusterRoleBinding
metadata:
name: fluent-bit-role-binding
roleRef:
apiGroup: rbac.authorization.k8s.io
kind: ClusterRole
name: fluent-bit-role
subjects:
- kind: ServiceAccount
name: fluent-bit
namespace: amazon-cloudwatch
---
apiVersion: v1
kind: ConfigMap
metadata:
name: fluent-bit-config
namespace: amazon-cloudwatch
labels:
k8s-app: fluent-bit
data:
fluent-bit.conf: |
[SERVICE]
Flush 5
Grace 30
Log_Level error
Daemon off
Parsers_File parsers.conf
HTTP_Server ${HTTP_SERVER}
HTTP_Listen 0.0.0.0
HTTP_Port ${HTTP_PORT}
storage.path /var/fluent-bit/state/flb-storage/
storage.sync normal
storage.checksum off
storage.backlog.mem_limit 5M
@INCLUDE application-log.conf
@INCLUDE dataplane-log.conf
@INCLUDE host-log.conf
application-log.conf: |
[INPUT]
Name tail
Tag application.*
Exclude_Path /var/log/containers/cloudwatch-agent*, /var/log/containers/fluent-bit*, /var/log/containers/aws-node*, /var/log/containers/kube-proxy*
Path /var/log/containers/*.log
multiline.parser docker, cri
DB /var/fluent-bit/state/flb_container.db
Mem_Buf_Limit 50MB
Skip_Long_Lines On
Refresh_Interval 10
Rotate_Wait 30
storage.type filesystem
Read_from_Head ${READ_FROM_HEAD}
[INPUT]
Name tail
Tag application.*
Path /var/log/containers/fluent-bit*
multiline.parser docker, cri
DB /var/fluent-bit/state/flb_log.db
Mem_Buf_Limit 5MB
Skip_Long_Lines On
Refresh_Interval 10
Read_from_Head ${READ_FROM_HEAD}
[INPUT]
Name tail
Tag application.*
Path /var/log/containers/cloudwatch-agent*
multiline.parser docker, cri
DB /var/fluent-bit/state/flb_cwagent.db
Mem_Buf_Limit 5MB
Skip_Long_Lines On
Refresh_Interval 10
Read_from_Head ${READ_FROM_HEAD}
[FILTER]
Name kubernetes
Match application.*
Kube_URL https://kubernetes.default.svc:443
Kube_Tag_Prefix application.var.log.containers.
Merge_Log On
Merge_Log_Key log_processed
K8S-Logging.Parser On
K8S-Logging.Exclude Off
Labels Off
Annotations Off
Use_Kubelet On
Kubelet_Port 10250
Buffer_Size 0
[OUTPUT]
Name cloudwatch_logs
Match application.*
region ${AWS_REGION}
log_group_name /aws/containerinsights/${CLUSTER_NAME}/application
log_stream_prefix ${HOST_NAME}-
auto_create_group true
extra_user_agent container-insights
dataplane-log.conf: |
[INPUT]
Name systemd
Tag dataplane.systemd.*
Systemd_Filter _SYSTEMD_UNIT=docker.service
Systemd_Filter _SYSTEMD_UNIT=containerd.service
Systemd_Filter _SYSTEMD_UNIT=kubelet.service
DB /var/fluent-bit/state/systemd.db
Path /var/log/journal
Read_From_Tail ${READ_FROM_TAIL}
[INPUT]
Name tail
Tag dataplane.tail.*
Path /var/log/containers/aws-node*, /var/log/containers/kube-proxy*
multiline.parser docker, cri
DB /var/fluent-bit/state/flb_dataplane_tail.db
Mem_Buf_Limit 50MB
Skip_Long_Lines On
Refresh_Interval 10
Rotate_Wait 30
storage.type filesystem
Read_from_Head ${READ_FROM_HEAD}
[FILTER]
Name modify
Match dataplane.systemd.*
Rename _HOSTNAME hostname
Rename _SYSTEMD_UNIT systemd_unit
Rename MESSAGE message
Remove_regex ^((?!hostname|systemd_unit|message).)*$
[FILTER]
Name aws
Match dataplane.*
imds_version v2
[OUTPUT]
Name cloudwatch_logs
Match dataplane.*
region ${AWS_REGION}
log_group_name /aws/containerinsights/${CLUSTER_NAME}/dataplane
log_stream_prefix ${HOST_NAME}-
auto_create_group true
extra_user_agent container-insights
host-log.conf: |
[INPUT]
Name tail
Tag host.dmesg
Path /var/log/dmesg
Key message
DB /var/fluent-bit/state/flb_dmesg.db
Mem_Buf_Limit 5MB
Skip_Long_Lines On
Refresh_Interval 10
Read_from_Head ${READ_FROM_HEAD}
[INPUT]
Name tail
Tag host.messages
Path /var/log/messages
Parser syslog
DB /var/fluent-bit/state/flb_messages.db
Mem_Buf_Limit 5MB
Skip_Long_Lines On
Refresh_Interval 10
Read_from_Head ${READ_FROM_HEAD}
[INPUT]
Name tail
Tag host.secure
Path /var/log/secure
Parser syslog
DB /var/fluent-bit/state/flb_secure.db
Mem_Buf_Limit 5MB
Skip_Long_Lines On
Refresh_Interval 10
Read_from_Head ${READ_FROM_HEAD}
[FILTER]
Name aws
Match host.*
imds_version v2
[OUTPUT]
Name cloudwatch_logs
Match host.*
region ${AWS_REGION}
log_group_name /aws/containerinsights/${CLUSTER_NAME}/host
log_stream_prefix ${HOST_NAME}.
auto_create_group true
extra_user_agent container-insights
parsers.conf: |
[PARSER]
Name syslog
Format regex
Regex ^(?<time>[^ ]* {1,2}[^ ]* [^ ]*) (?<host>[^ ]*) (?<ident>[a-zA-Z0-9_\/\.\-]*)(?:\[(?<pid>[0-9]+)\])?(?:[^\:]*\:)? *(?<message>.*)$
Time_Key time
Time_Format %b %d %H:%M:%S
[PARSER]
Name container_firstline
Format regex
Regex (?<log>(?<="log":")\S(?!\.).*?)(?<!\\)".*(?<stream>(?<="stream":").*?)".*(?<time>\d{4}-\d{1,2}-\d{1,2}T\d{2}:\d{2}:\d{2}\.\w*).*(?=})
Time_Key time
Time_Format %Y-%m-%dT%H:%M:%S.%LZ
[PARSER]
Name cwagent_firstline
Format regex
Regex (?<log>(?<="log":")\d{4}[\/-]\d{1,2}[\/-]\d{1,2}[ T]\d{2}:\d{2}:\d{2}(?!\.).*?)(?<!\\)".*(?<stream>(?<="stream":").*?)".*(?<time>\d{4}-\d{1,2}-\d{1,2}T\d{2}:\d{2}:\d{2}\.\w*).*(?=})
Time_Key time
Time_Format %Y-%m-%dT%H:%M:%S.%LZ
---
apiVersion: apps/v1
kind: DaemonSet
metadata:
name: fluent-bit
namespace: amazon-cloudwatch
labels:
k8s-app: fluent-bit
version: v1
kubernetes.io/cluster-service: "true"
spec:
selector:
matchLabels:
k8s-app: fluent-bit
template:
metadata:
labels:
k8s-app: fluent-bit
version: v1
kubernetes.io/cluster-service: "true"
spec:
containers:
- name: fluent-bit
image: public.ecr.aws/aws-observability/aws-for-fluent-bit:stable
imagePullPolicy: Always
env:
- name: AWS_REGION
valueFrom:
configMapKeyRef:
name: fluent-bit-cluster-info
key: logs.region
- name: CLUSTER_NAME
valueFrom:
configMapKeyRef:
name: fluent-bit-cluster-info
key: cluster.name
- name: HTTP_SERVER
valueFrom:
configMapKeyRef:
name: fluent-bit-cluster-info
key: http.server
- name: HTTP_PORT
valueFrom:
configMapKeyRef:
name: fluent-bit-cluster-info
key: http.port
- name: READ_FROM_HEAD
valueFrom:
configMapKeyRef:
name: fluent-bit-cluster-info
key: read.head
- name: READ_FROM_TAIL
valueFrom:
configMapKeyRef:
name: fluent-bit-cluster-info
key: read.tail
- name: HOST_NAME
valueFrom:
fieldRef:
fieldPath: spec.nodeName
- name: HOSTNAME
valueFrom:
fieldRef:
apiVersion: v1
fieldPath: metadata.name
- name: CI_VERSION
value: "k8s/1.3.20"
resources:
limits:
memory: 200Mi
requests:
cpu: 500m
memory: 100Mi
volumeMounts:
# Please don't change below read-only permissions
- name: fluentbitstate
mountPath: /var/fluent-bit/state
- name: varlog
mountPath: /var/log
readOnly: true
- name: varlibdockercontainers
mountPath: /var/lib/docker/containers
readOnly: true
- name: fluent-bit-config
mountPath: /fluent-bit/etc/
- name: runlogjournal
mountPath: /run/log/journal
readOnly: true
- name: dmesg
mountPath: /var/log/dmesg
readOnly: true
terminationGracePeriodSeconds: 10
hostNetwork: true
dnsPolicy: ClusterFirstWithHostNet
volumes:
- name: fluentbitstate
hostPath:
path: /var/fluent-bit/state
- name: varlog
hostPath:
path: /var/log
- name: varlibdockercontainers
hostPath:
path: /var/lib/docker/containers
- name: fluent-bit-config
configMap:
name: fluent-bit-config
- name: runlogjournal
hostPath:
path: /run/log/journal
- name: dmesg
hostPath:
path: /var/log/dmesg
serviceAccountName: fluent-bitIf you find any issue you can do the trouble shooting.
Troubleshoot Fluent Bit deployment
To install and use all the network related tool no need to add it in the existing pod use below manifest file and create new pod to do the network testing.
apiVersion: v1
kind: Pod
metadata:
  name: netshoot
  #namespace: default
spec:
  containers:
  - name: netshoot
    image: nicolaka/netshoot:latest
    command:
      - sleep
      - "3600"
    imagePullPolicy: IfNotPresent
  restartPolicy: Always
kubectl apply netshoot-pod.yaml
kubectl exec -it netshoot -- /bin/bash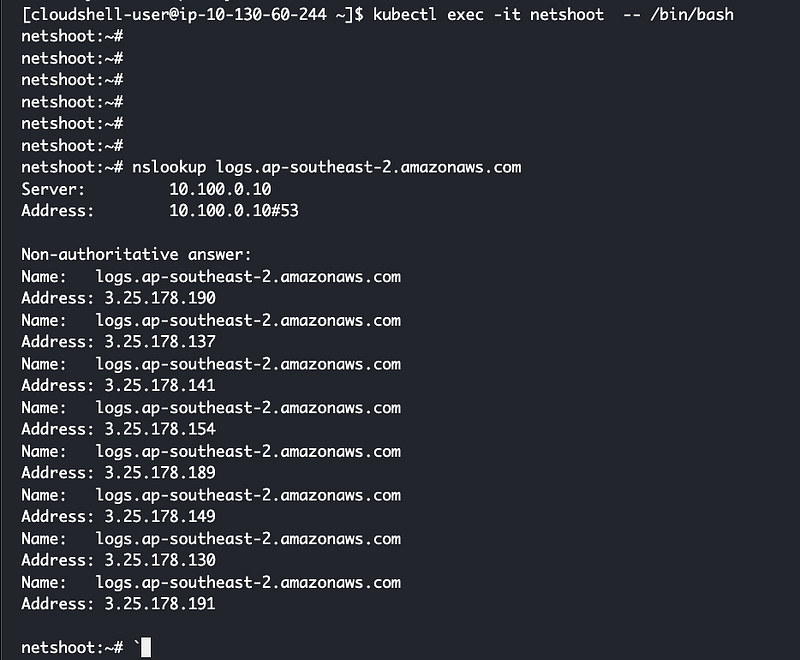
Also to collect the pod information we can use below github link.
https://github.com/aws-samples/eks-pod-information-collector
EKS Pod Information Collector (EPIC)
curl -O https://raw.githubusercontent.com/aws-samples/eks-pod-information-collector/main/eks-pod-information-collector.sh
bash eks-pod-information-collector.sh -p <pod_name> -n <pod_namespace> -s [service_name] -i [ingress_name]
OR
bash eks-pod-information-collector.sh --podname <pod_name> --namespace <pod_namespace> --service [service_name] --ingress [ingress_name]
NOTE: -p or --podname & -n or --namespace are mandatory input parameters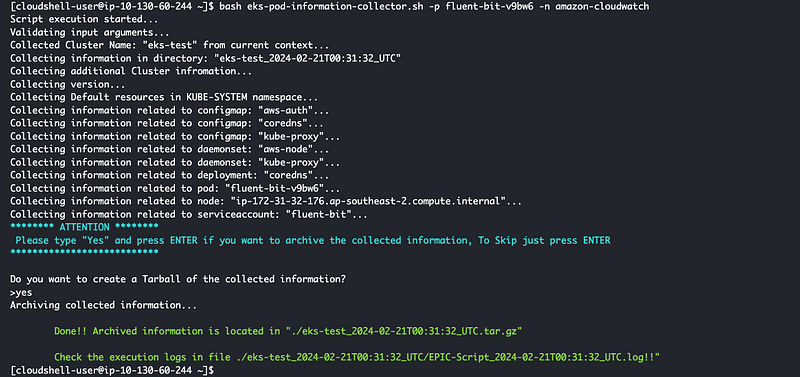
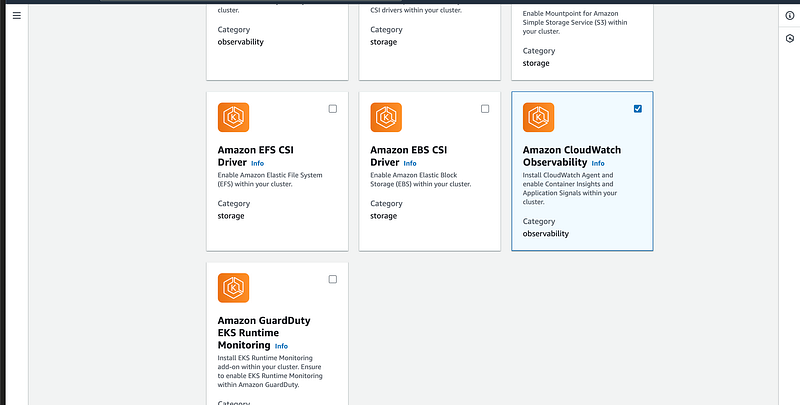
B. By using AWS addon (Amazon CloudWatch Observability)
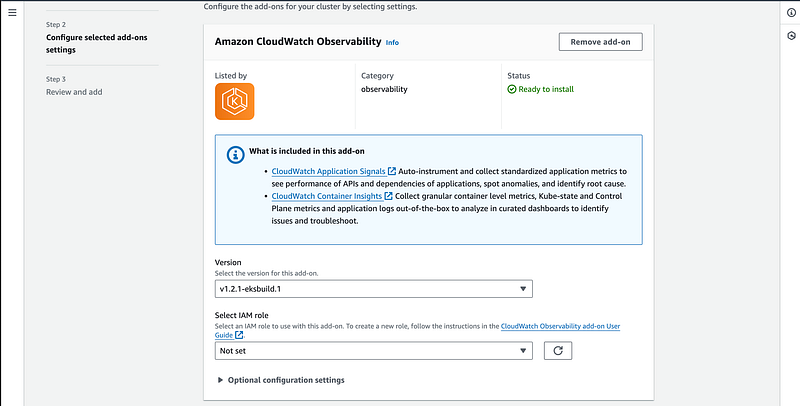
The Amazon CloudWatch Observability EKS add-on installs the CloudWatch Agent and the Fluent-bit agent on an Amazon EKS cluster, with Container Insights enhanced observability for Amazon EKS and CloudWatch Application Signals enabled by default. Using the add-on, you can collect infrastructure metrics, application performance telemetry, and container logs from the Amazon EKS cluster.
With Container Insights with enhanced observability for Amazon EKS, Container Insights metrics are charged per observation instead of being charged per metric stored or log ingested. For Application Signals, billing is based on inbound requests to your applications, outbound requests from your applications, and each configured service level objective (SLO). Each inbound request received generates one application signal, and each outbound request made generates one application signal. Every SLO creates two application signals per measurement period. For more information about CloudWatch pricing, see Amazon CloudWatch Pricing.
The Amazon CloudWatch Observability EKS add-on is supported on Amazon EKS clusters running with Kubernetes version 1.23 or later.
When you install the add-on, you must also grant IAM permissions to enable the CloudWatch agent to send metrics, logs, and traces to CloudWatch. There are two ways to do this:
- Attach a policy to the IAM role of your worker nodes. This option grants permissions to worker nodes to send telemetry to CloudWatch.
- Use an IAM role for service accounts for the agent pods, and attach the policy to this role. This works only for Amazon EKS clusters. This option gives CloudWatch access only to the appropriate agent pods.
This addon does not give any flexibility to send the logs to 3rd party tool such as splunk, datadog etc. To get that level of flexibility we can use fluent bit or open telemetry.
FluentBit vs AWS Cloudwatch Observability Addon:
- Integration: Fluent Bit is more about general-purpose log processing and can be used across various platforms and cloud providers, whereas AWS Observability addons are specifically tailored for the AWS ecosystem.
- Use Case: Fluent Bit is ideal for log aggregation and forwarding in environments where customizability and lightweight operation are critical, such as in Kubernetes clusters. AWS Observability addons are better suited for users deeply invested in AWS, looking for an integrated solution for monitoring AWS resources and applications.
- Management: Fluent Bit requires manual setup and configuration but offers flexibility in processing and forwarding logs. AWS Observability addons, being managed services, reduce the operational burden but are less flexible outside AWS services.
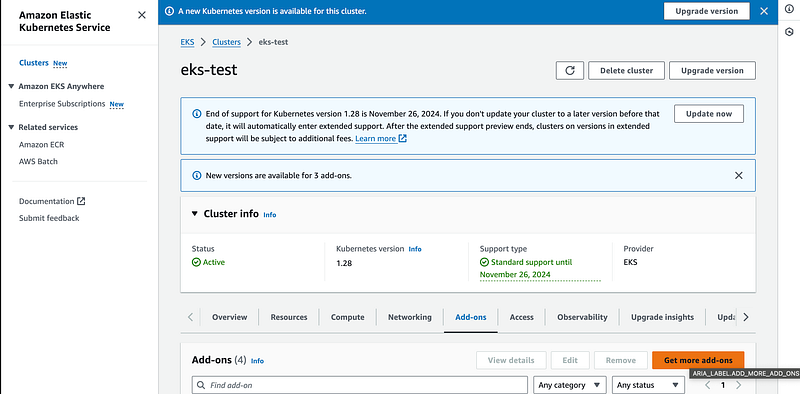
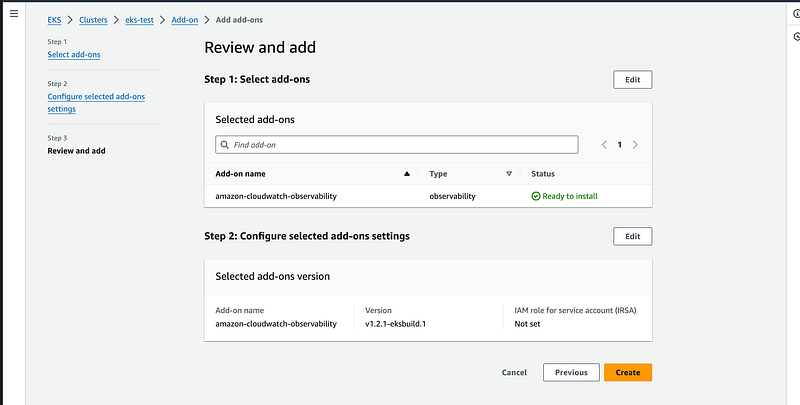
Step 1:
Enable addon from aws cosole you can do this by using aws cli also.
To enable this we have to delete the existing fluent bit.
Run below command in you terminal if you have created from earlier step.
ClusterName='eks-test'
LogRegion='ap-southeast-2'
FluentBitHttpPort='2020'
FluentBitReadFromHead='Off'
[[ ${FluentBitReadFromHead} = 'On' ]] && FluentBitReadFromTail='Off'|| FluentBitReadFromTail='On'
[[ -z ${FluentBitHttpPort} ]] && FluentBitHttpServer='Off' || FluentBitHttpServer='On'
curl https://raw.githubusercontent.com/aws-samples/amazon-cloudwatch-container-insights/latest/k8s-deployment-manifest-templates/deployment-mode/daemonset/container-insights-monitoring/quickstart/cwagent-fluent-bit-quickstart-enhanced.yaml | sed 's/{{cluster_name}}/'${ClusterName}'/;s/{{region_name}}/'${LogRegion}'/;s/{{http_server_toggle}}/"'${FluentBitHttpServer}'"/;s/{{http_server_port}}/"'${FluentBitHttpPort}'"/;s/{{read_from_head}}/"'${FluentBitReadFromHead}'"/;s/{{read_from_tail}}/"'${FluentBitReadFromTail}'"/' | kubectl delete -f -
Now lets add the addon.
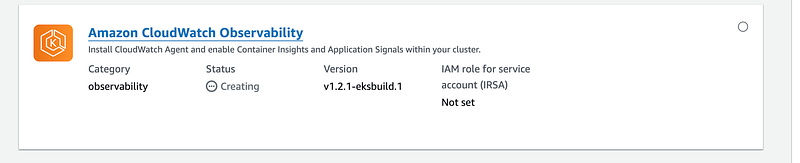
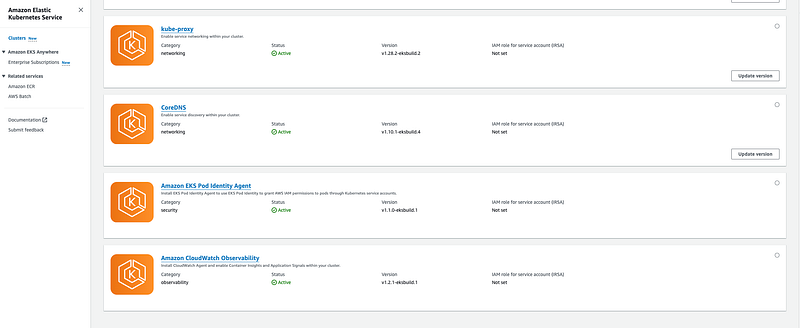
Step 2 : Verify and Monitor Logs
- Check if there are pods created by this addon.
kubectl get pods -A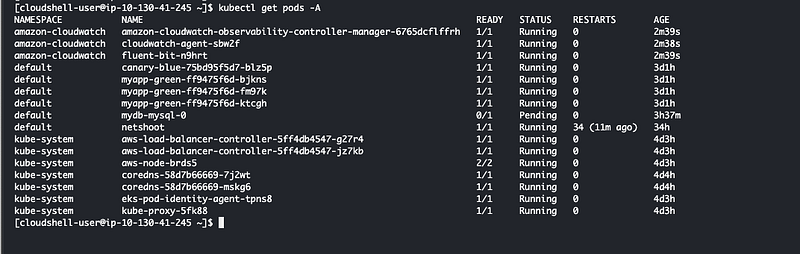
Check from AWS console
Check AWS cloudwatch dashboard under container insights.
Real-World Use Cases 🌍
- Application Performance Monitoring: Use CloudWatch Container Insights to monitor the performance of microservices-based applications, ensuring they meet performance SLAs.
- Cost Optimization: Analyze resource utilization patterns to identify over-provisioned resources and optimize cluster sizing, reducing operational costs.
- Security and Compliance: Leverage log data to monitor for compliance with security policies and standards, helping you maintain a robust security posture.
Note: I will be taking Prometheus and Amazon Managed Grafana in another blog since this is a big and seperate topic.
Conclusion: Empowering Kubernetes Management with Insights 🚀
AWS CloudWatch Container Insights for Amazon EKS offers a powerful solution for monitoring, managing, and optimizing Kubernetes clusters. By providing deep insights into the performance, health, and security of containerized applications, it empowers developers and administrators to maintain high availability, efficiency, and security.
Whether you’re managing large-scale microservices architectures or developing new cloud-native applications, integrating CloudWatch Container Insights into your operational toolkit can significantly enhance your Kubernetes management strategy. 💼🔧
Please follow me for more such innovative blogs And if you find my blogs helpful, I’d really appreciate your claps — they motivate me to keep sharing more valuable insights.
Thank you for being Awesome!
In Plain English 🚀
Thank you for being a part of the In Plain English community! Before you go:
- Be sure to clap and follow the writer ️👏️️
- Follow us: X | LinkedIn | YouTube | Discord | Newsletter
- Visit our other platforms: Stackademic | CoFeed | Venture | Cubed
- More content at PlainEnglish.io


