
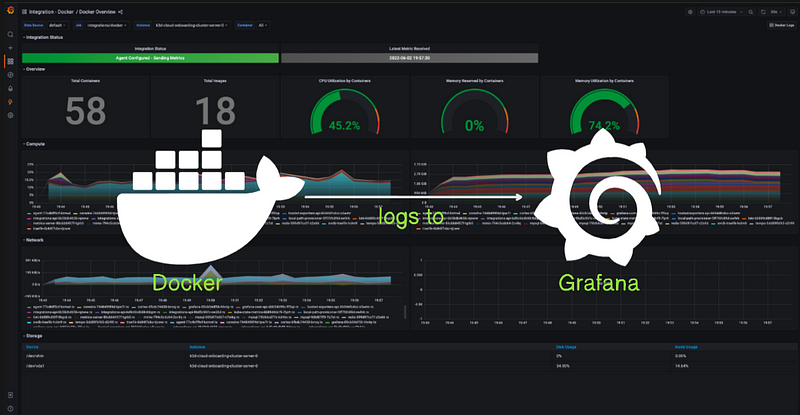
Monitoring Docker Containers with Grafana, Loki, and Promtail
In this blog, I will teach :
- How you can run Grafana, Loki, and Promtail using docker-compose.
- How you can monitor the docker logs using Grafana
Prerequisites:
Make sure your system has the following tools installed
- Docker
- Docker Compose
To install them use the below command:
- Docker:
sudo apt-get update
sudo apt install docker.io
- Docker Compose:
# Download Docker Compose Binary
sudo curl -L "https://github.com/docker/compose/releases/latest/download/docker-compose-$(uname -s)-$(uname -m)" -o /usr/local/bin/docker-compose

#Make Binary Executable
sudo chmod +x /usr/local/bin/docker-compose

#Add User to Docker Group
sudo usermod -aG docker $USER

#Verify Installation
docker-compose --version
Configurations:
To install the Grafana, Loki, and Promtail using Docker Compose we need two YAML files: docker-compose.yaml and loki-config.yaml.
docker-compose.yaml:
version: '3'

services:
  loki:
    image: grafana/loki:latest
    ports:
      - "3100:3100"
    networks:
      - loki-net

  promtail:
    image: grafana/promtail:latest
    volumes:
      - ./promtail-config.yaml:/etc/promtail/promtail-config.yaml
    networks:
      - loki-net
    depends_on:
      - loki

  grafana:
    image: grafana/grafana:latest
    ports:
      - "3000:3000"
    environment:
      - GF_SECURITY_ADMIN_PASSWORD=admin
    networks:
      - loki-net
    depends_on:
      - loki

networks:
  loki-net:
    external: true
Explanation:
Services:
- Loki: Uses the official Grafana Loki Docker image. It exposes port 3100 and connects to the “loki-net” network.
- Promtail: Also uses the official Grafana Promtail Docker image. It mounts a local configuration file
promtail-config.yamlinto the container at/etc/promtail/promtail-config.yaml. It connects to the "loki-net" network and depends on the Loki service. - Grafana: Uses the official Grafana Docker image, exposes port 3000, sets the admin password to “admin” using an environment variable, and connects to the “loki-net” network. It depends on the Loki service.
Networks:
- loki-net: Declares a custom network named “loki-net” with the
external: trueflag. This suggests that the network is created externally (possibly before running this Docker Compose file) and is not managed by Docker Compose itself.
Version:
- Specifies the version of the Docker Compose file format. In this case, it’s version 3.
loki-config.yaml:
server:
  http_listen_port: 9080
  grpc_listen_port: 0

positions:
  filename: /tmp/positions.yaml

clients:
  - url: http://loki:3100/loki/api/v1/push

scrape_configs:
  - job_name: system
    static_configs:
      - targets:
          - localhost
        labels:
          job: varlogs
          __path__: /var/log/*log

  - job_name: docker
    static_configs:
      - targets:
          - localhost
        labels:
          job: docker_logs
          __path__: /var/lib/docker/containers/*/*-json.log
Explanation:
Server Configuration:
http_listen_port: 9080: Prometheus will listen for HTTP requests on port 9080.grpc_listen_port: 0: Disables gRPC (Google Remote Procedure Call) for this Prometheus server.
Positions Configuration:
filename: /tmp/positions.yaml: Specifies the file path where Prometheus will store the current positions in the logs. This information is used to resume scraping after a restart.
Clients Configuration:
- url: http://loki:3100/loki/api/v1/push: Configures Prometheus to push logs to Loki, a horizontally scalable, highly available log aggregation system.
Scrape Configurations:
System Job:
job_name: system: Defines a job named "system" to scrape metrics related to the system.static_configs: Configures static targets to scrape.- targets: - localhost: Prometheus will scrape metrics from the local machine.labels: Specifies additional labels for the scraped data.job: varlogs: Identifies this as a job for scraping metrics from/var/logdirectories.__path__: /var/log/*log: Specifies the path pattern to match log files.
Docker Job:
job_name: docker: Defines a job named "docker" to scrape metrics related to Docker containers.static_configs: Configures static targets to scrape.- targets: - localhost: Prometheus will scrape metrics from the local machine.labels: Specifies additional labels for the scraped data.job: docker_logs: Identifies this as a job for scraping metrics from Docker containers.__path__: /var/lib/docker/containers/*/*-json.log: Specifies the path pattern to match Docker container log files.
Before running these 2 configuration files we need to create the docker network loki-net, run the below command to create:
docker network create loki-net
Before you run the docker-compose.yaml or any other docker container, you need to do 2 more things:
1. Installing Docker Plugins:
Install the docker drivers for Docker and Grafana/Loki:
docker plugin install grafana/loki-docker-driver:2.9.1 --alias loki --grant-all-permissions2.Configure Docker daemon.json:
At location /etc/docker/daemon.json paste the below code:
 {
    "log-driver": "loki",
    "log-opts": {
      "loki-url": "http://localhost:3100/loki/api/v1/push",
      "loki-batch-size": "400",
    }
  }
Restart the Docker service:
sudo systemctl restart docker
Run the docker-compose.yaml:
docker-compose up -d
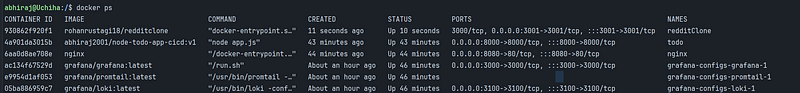
Running Docker containers:
Run the Docker images of your choice, whose logs you want to monitor. Here I am running the following Docker images:
- Nginx
- Todo
- Reddit-clone
Monitoring Docker Containers logs in Grafana
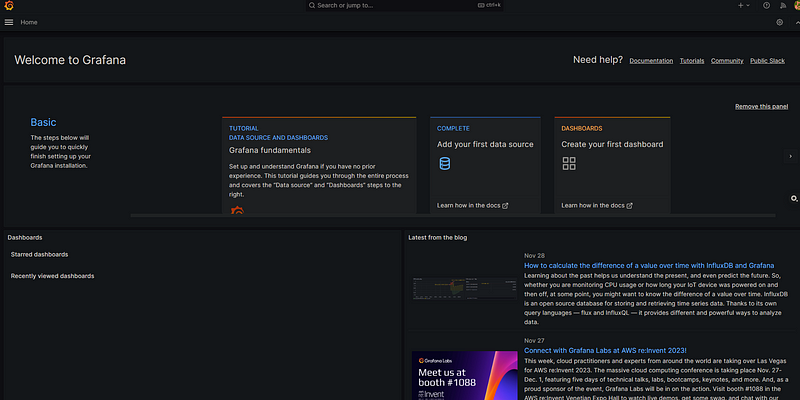
- Open the Grafana in your web browser running at port number 3000.
If you are opening Grafana for the first time use username: admin and password: admin.
Click on Add your first data source.
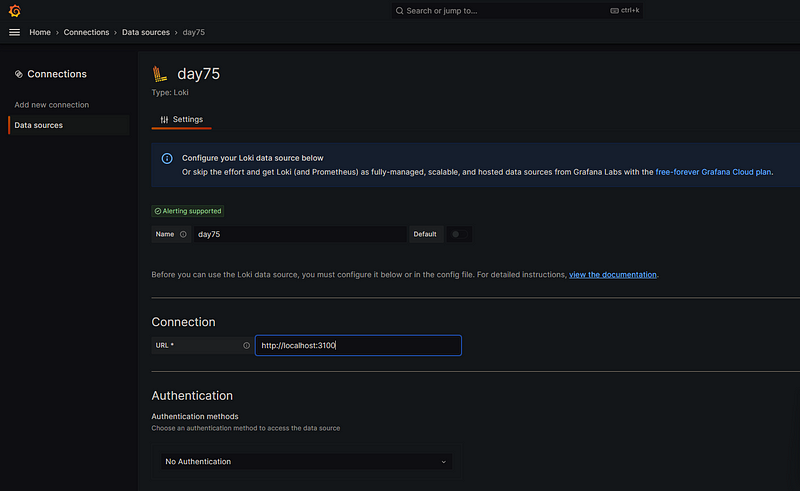
- Choose Loki, as the data source. Loki is used for connecting the logs of an application.
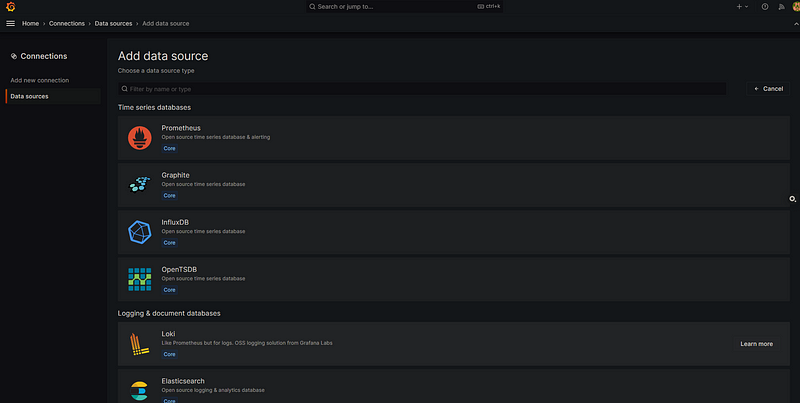
- Enter the name and connection URL, scroll down to test and save
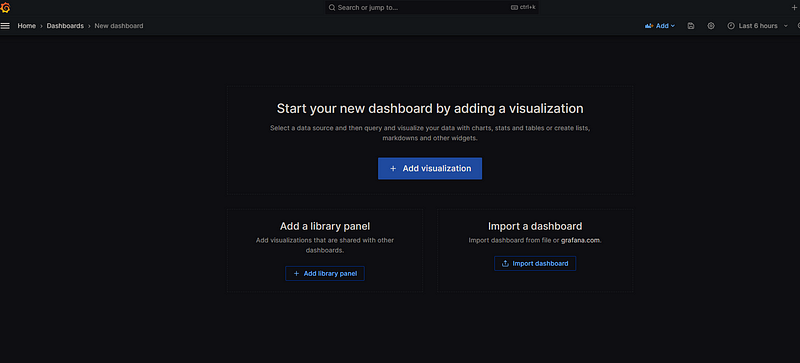
- Click on Add visualization in order to build the dashboard.
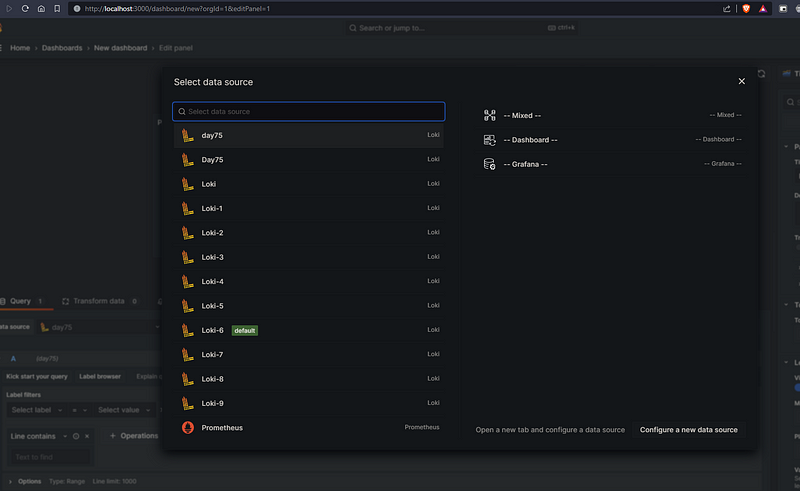
- Select the desired data source.
- Select the label,
container_nameselect the value, i.e the running container name, let’s start with nginx logs:
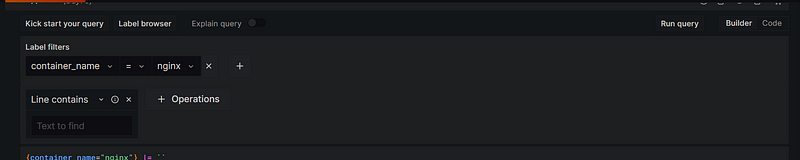
- Select the Logs as the Data visualization tool from the right side
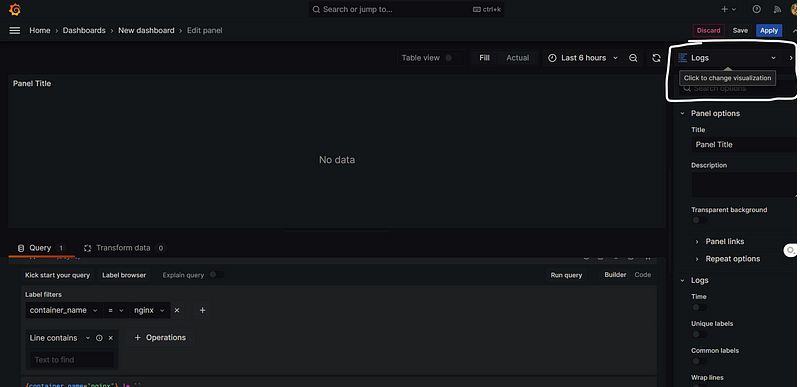
Click on the run query.
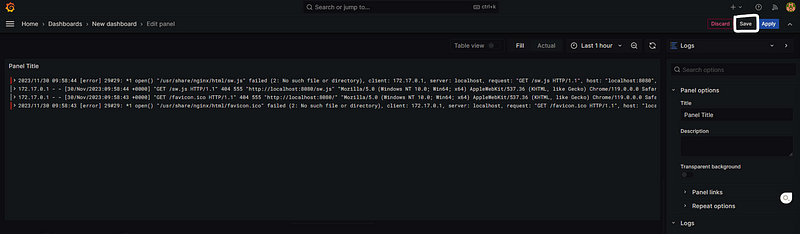
- This query returns the logs generated by the docker container, nginx.
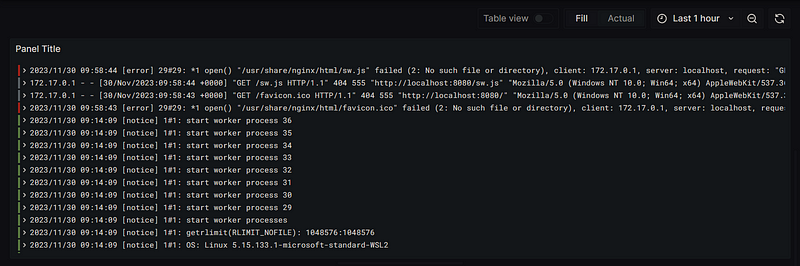
You can also view logs based on a specific time frame of your choice; currently, it displays all the logs generated in the last 1 hour.
- Now change the
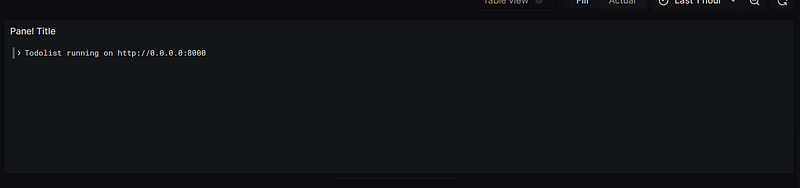
container_nametotodo:
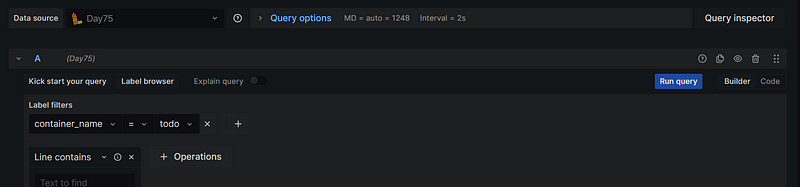
Logs generated for todo container:
- Change the
container_nametoredditClone:
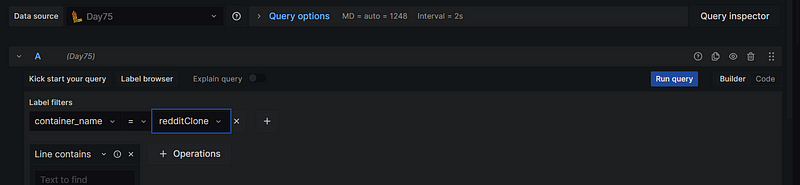
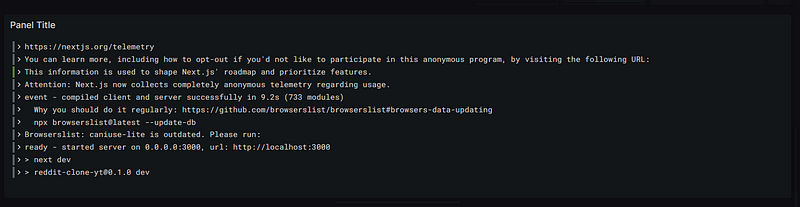
Logs Generated :
Now You can save this Dashboard.
- Click on
Save
- Enter the Dashboard details like name, description and choose the folder to save the dashboard
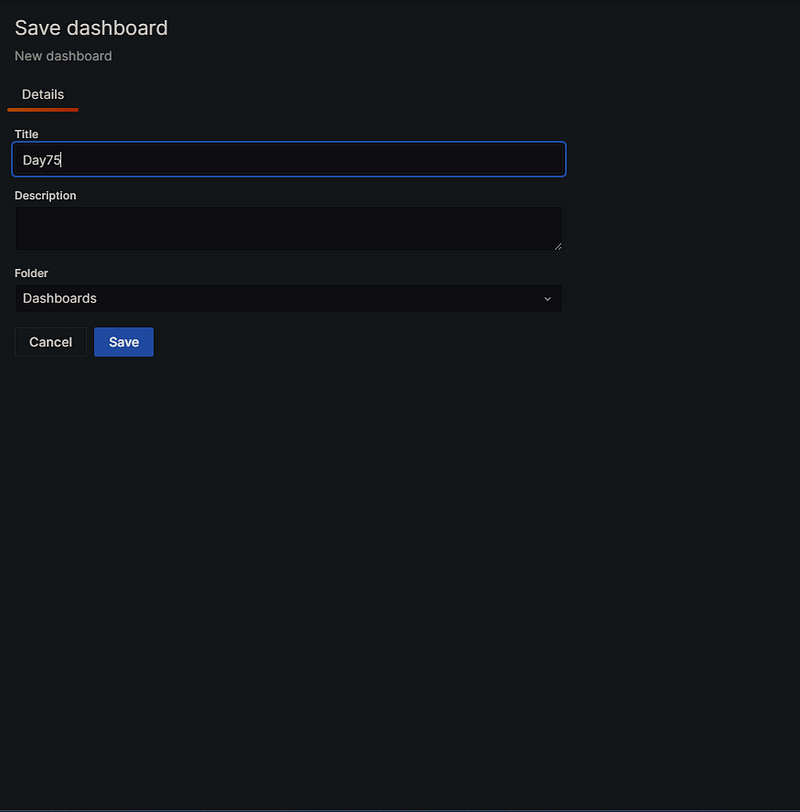
- Your Dashboard has been saved
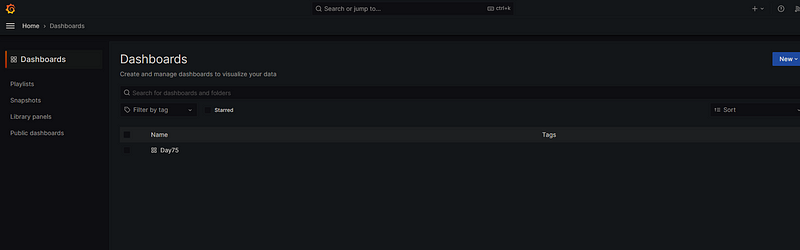
You can change the dashboard, view it, and do some modifications in the dashboard.
Useful links if you get stuck:
- Youtube tutorial for setting up Grafana, Loki, and Promtail using Docker Compose and instaling Docker pluginm configuring: Meet Grafana LOKI, a Log Aggregation System for EVERYTHING
- Grafana Offical Documentation: Docker driver client


