
Monitoring Databricks jobs through calls to the REST API
Monitoring jobs that run in a Databricks production environment requires not only setting up alerts in case of failure but also being able to easily extract statistics about jobs running time, failure rate, most frequent failure cause, and other user-defined KPIs.
The Databricks workspace provides through its UI a fairly easy and intuitive way of visualizing the run history of individual jobs. The matrix view, for instance, allows for a quick overview of recent failures and shows a rough comparison in terms of run times between the different runs.
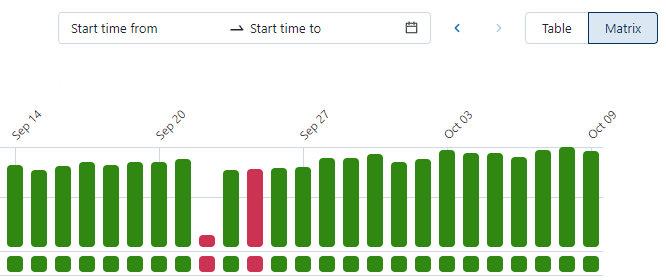
What about computing statistics about failure rates or comparing average run times between different jobs? This is where things become less straightforward.
The job runs tab in the Workflows panel shows the list of all the jobs that have run in the last 60 days in your Databricks workspace. But this list cannot be exported directly from the UI, at least at the time of writing.

Luckily, the same information (and some extra details) can be extracted through calls to the Databricks jobs list API. The data is retrieved in JSON format and can easily be transformed into a DataFrame, from which statistics and comparisons can be derived.
In this post, I will show how to connect to the Databricks REST API from a Jupiter Notebook running in your Databricks workspace, extract the desired information, and perform some basic monitoring and analysis.
1. Generate a Databricks Personal Access Token
To connect to the Databricks API you will first need to authenticate, in the same way are asked to do it when connecting through the UI. In my case, I will use a Databricks personal access token generated through a call to the Databricks Token API for authentication in order to avoid storing connection information in my notebook.
First, we need to configure the call to the Token API, by providing the request URL, the request body, and its headers. In the example below, I am using Databricks secrets to extract the Tenant ID and build the API URL for a Databricks workspace hosted by Microsoft Azure. The resource 2ff814a6–3304–4ab8–85cb-cd0e6f879c1d represents the Azure programmatic ID for Databricks, while the Application ID and Password are extracted again from the Databricks secrets.
It is good practice to use Databricks secrets to store this type of sensitive information and avoid entering credentials directly into a notebook. Otherwise, all the calls to dbutils.secrets can be replaced with the explicit values in the code above.
After this setup, we can simply call the Token API using Python’s requests library and generate the token.
2. Call the Databricks jobs API
Now that we have our personal access token, we can configure the call to the Databricks jobs API. We need to provide the URL for the Databricks instance, the targeted API (in this case jobs/runs/list to extract the list of jobs runs), and the API version (2.1 is currently the most recent). We use the previously generated token as the bearer token in the header for the API call.
By default, the returned response is limited to a maximum of 25 runs, starting from the provided offset. I created a loop to extract the full list based on the has_more attribute of the returned response.
3. Extract and analyze the data
The list of jobs runs is returned as a list of JSON by the API call and I used Pandas json_normalize to convert this list to a Pandas DataFrame. This operation converts the data to the following format :
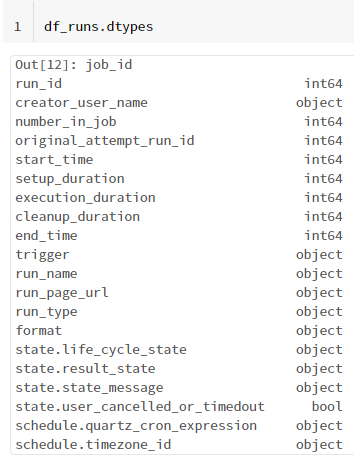
To include task and cluster details in the response you can set the expand_tasks parameter to True in the request params as stated in the API documentation.
Starting from this information we can perform some monitoring and analysis. I used for instance the state.result_state information to compute the percentage of failed runs in the last 60 days:
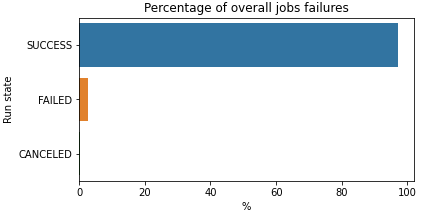
Many useful statistics can be easily extracted, such as the number of failed jobs each day across all scheduled Databricks jobs. We can have a quick overview of the error messages logged by the clusters for the failed jobs by looking at the column state.state_message.
Because we have access to each run’s start and end time we can compute the job run time and easily visualize any trend and detect potential problems early on.
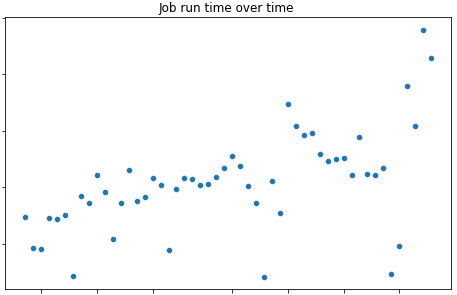
Once we have access to this data in this easy-to-exploit format, the type of monitoring KPIs that we want to compute can depend on the type of application. The code computing these KPIs can be stored in a notebook that is scheduled to run regularly and that sends out monitoring reports.
Conclusion
This post presents some examples of Databricks jobs monitoring that can be implemented based on information extracted through the Databricks REST API. This method can provide an overall view of all the jobs that are active in your Databricks workspace in a format that can easily be used to perform investigations or analysis.


