
Monitor your EC2 instances with Prometheus Exporters
Mix the old fashioned EC2 world with your Prometheus Kubernetes Stack
I’m starting a new series of articles on which I will explain you how you can monitor your applications deployed on some classic EC2 instances with your Prometheus stack running on a Kubernetes cluster (EKS in our use case).
- This first article will focus on the EC2 part, and draw the basic of the architecture we’re going to deploy. We will mostly explore the concept of exporters, and how we will expose those exporter to our observability stack.
- The second one will dig the interconnection between our AWS accounts. We are going to deploy our application stack and our observability stack on two different accounts. We will explore the pillars of event driven architecture.
- The third one, and last, will go trough the events responses received from the account A, and how we can use them to create Custom Resource Definition (CRD) in response of those events.
- I will also regroup at the end all the three articles in one, if people doesn’t want to jump across articles.
Prometheus uses the concept of exporters. An exporter is designed to expose metrics that will be grabbed by Prometheus, at a customization frequency. Key concepts to have in mind when we speak about exporters:
- Expose an HTTP endpoint for available metrics
- Every metric is a number, because Prometheus is a time series like database
- Metrics should use labels while exposed. This allows us to filter in a more efficient way with tools like Grafana. A good example from the guideline is:
For example, rather than
http_responses_500_totalandhttp_responses_403_total, create a single metric calledhttp_responses_totalwith acodelabel for the HTTP response code. You can then process the entire metric as one in rules and graphs.
There is a lot of exporters available here (such as Nginx, Cloudflare, Gitlab…), supported by the community or the editor itself. You can also write your own exporter if you have specific requirements. I also wrote an article about that here:
For each exporter running, we are using docker to launch them. Why using docker? It allows us to use a stable, lightweight and standardized code.
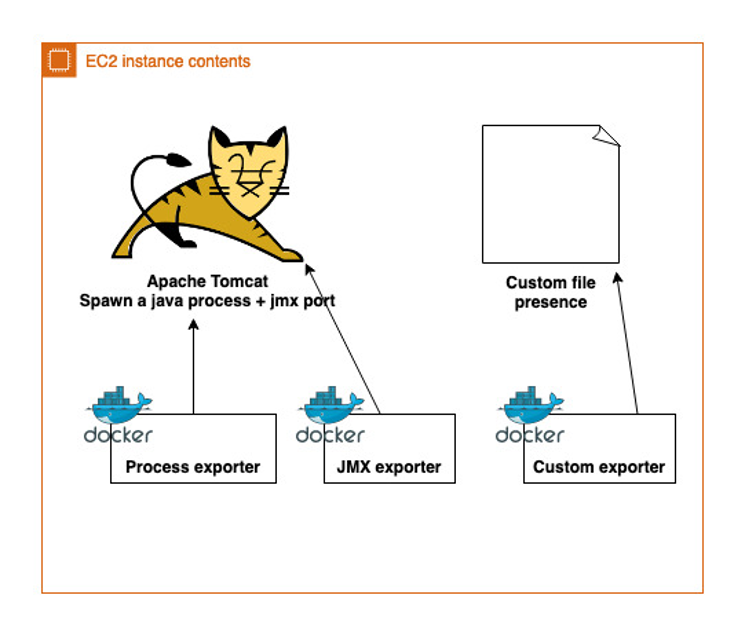
On the above diagram, you’ll find an example of a classic application running under Tomcat, on which we have to monitor:
- The presence of the Tomcat process. For that purpose, we will use the process-exporter (https://github.com/ncabatoff/process-exporter). This exporter use a yaml file to check the presence at system level of a process (I.E it create a metric per process, which an associated counter (that you can translate more or less in a ps command with wc pipped)).
- JMX-exporter (https://github.com/prometheus/jmx_exporter), that will connect to our Java application, and expose in a Prometheus format the Mbeans your application offers.
- A custom-exporter, because we want to perform some specific application checks
Note that this diagram does not include the docker exporter (https://github.com/prometheus-net/docker_exporter) which can be use to monitor your running docker containers.Now that you have understood what’s running in our EC2, we need to signal Prometheus that a new instance has been spawned, and needs to be monitored.
Each of our EC2 instance is part of an auto scaling group (really important!) — even if the min/max/desired capacity is set to 1 and you don’t use the scale in/out options.
Why using an auto scaling group even if we only require 1 instance running?
- It allows AWS to respawn a new instance in case of EC2 failure
- It allows us to play with auto scaling events to communicate with the Prometheus stack
Sounds promising, but how we will use the ASG event to talk with prometheus, and how Prom will know which ports do we expose?
Time to introduce an old friend of mine, the lifecycle hook. If you look at below diagram, you can use the LCH to determine when an instance is in service.
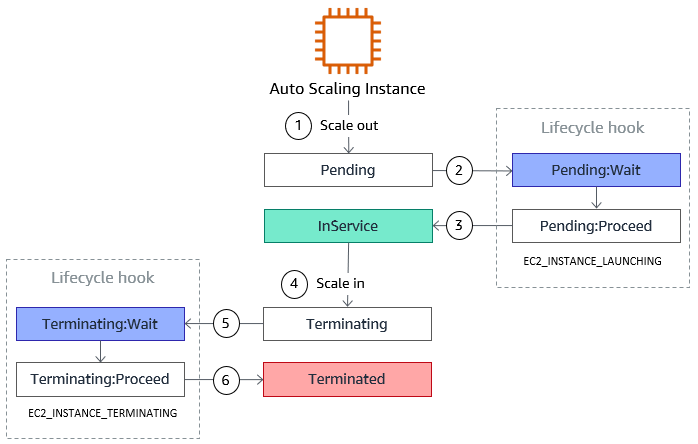
An other interesting feature with the lifecycle hook, is that you can pass some custom metadata on it. If you still follow me, you’ve probably understood that we will pass the docker port exposed of our instance on those metadata.
Below code will collect all the exposed ports by any docker container running in our system:
Then, you just need to update your lifecycle hook:
aws autoscaling put-lifecycle-hook --lifecycle-hook-name my_lifecycle_hook --auto-scaling-group-name my_asg --region my_region --notification-metadata "{\"name\": \"my_asg\", \"ports\": [${PORT_LIST}]}"Before sending him a CONTINUE signal:
aws autoscaling complete-lifecycle-action --lifecycle-action-result CONTINUE --instance-id ;y_instance_id--lifecycle-hook-name my_lifecycle_hook--auto-scaling-group-name my_asg --region my_regionCompleting the lifecycle hook will trigger an event that we are going to catch with AWS EventBridge — and this will be discussed in the second article of this series.
To summarize the discussed concepts here
- We have EC2 instances running as part of an AutoScalingGroup
- Each instance is running X prometheus exporters as docker containers (one per exporter)
- We are using lifecycle hook to generate AWS events that we’re going to catch and use to communicate with an other AWS account. We also use that ASG feature to push some extra metadata, which are the ports we expose for all of our exporters.
Hope you have enjoyed the first article of this series, and I will see you in the second one!
More content at PlainEnglish.io. Sign up for our free weekly newsletter. Follow us on Twitter, LinkedIn, YouTube, and Discord. Interested in Growth Hacking? Check out Circuit.


