
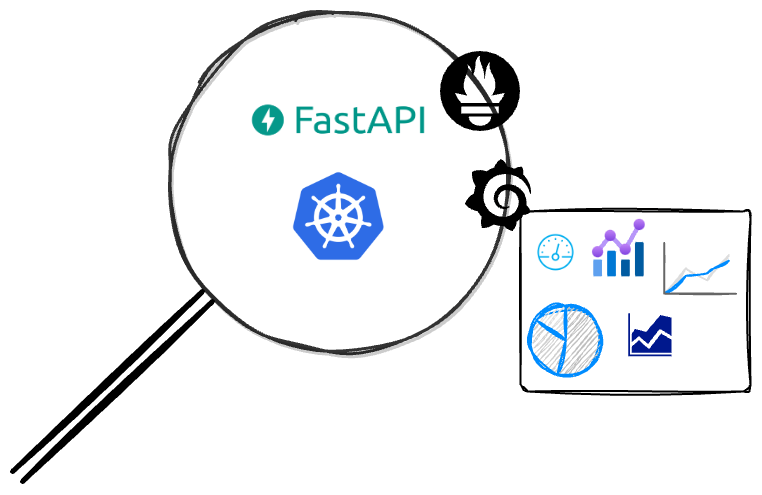
Monitor K8s and Application metrics using Prometheus
To troubleshoot an issue, you must know what is happening under the hood.
Introduction
Observability from SRE (Site Reliability Engineering) terms means, gaining in-depth details about the application and the underlying infrastructure to understand how they operate and how can teams use these details to troubleshoot the issues. The details are mainly from the logs, metrics, and traces.
In this blog, we
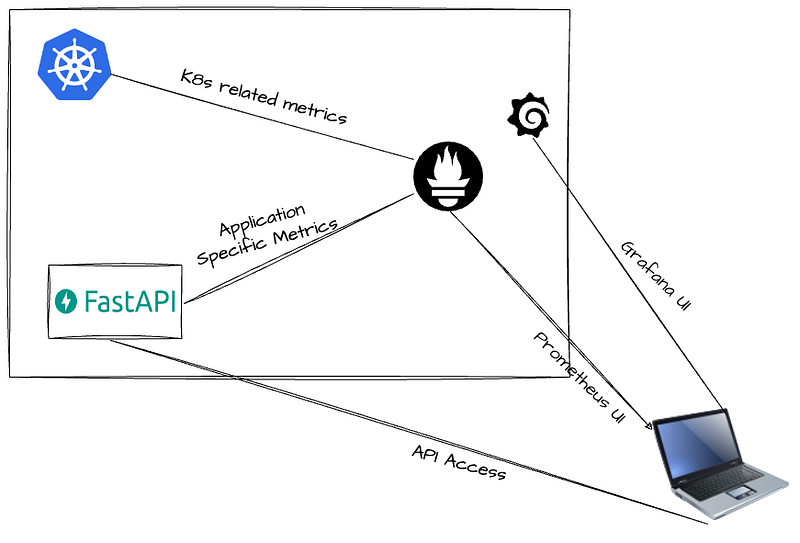
- Set up Prometheus on K8s to collect the K8s-related metrics
- Instrument a FastAPI application to expose the application-specific metrics
Big Picture
Prometheus
- Prometheus is an open-source tool that was originally built at SoundCloud for monitoring and alerting.
- Prometheus primarily deals with “metrics”.
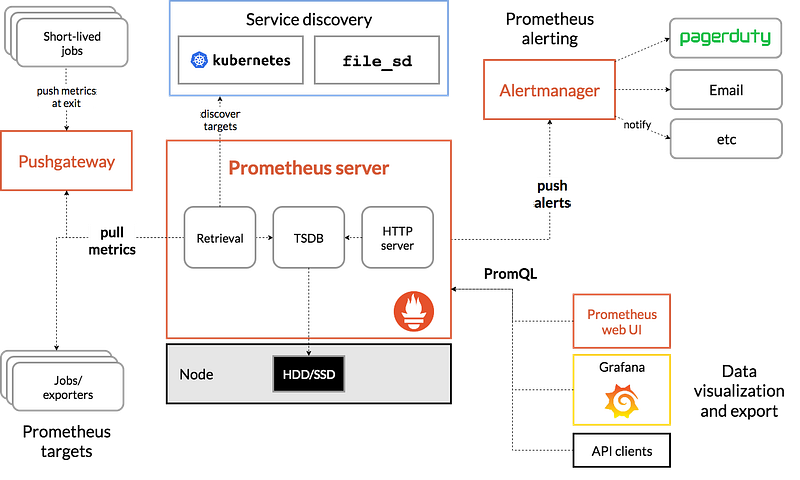
For details related to Prometheus architecture please check the official docs: https://prometheus.io/docs/introduction/overview/#architecture
Should I run Prometheus inside or outside the K8s Cluster?
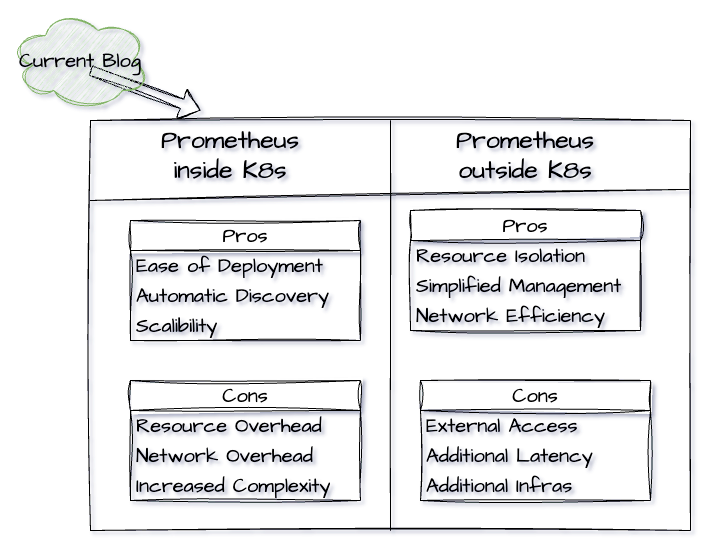
For this blog, I am installing Prometheus inside the K8s cluster.
Okay, What are some of the ways to set up Prometheus inside the K8s cluster?
- Manual (AVOID this as it's hard to manage): Create the K8s manifest files for each part of the Prometheus
- Using Prometheus Helm Chart: Contains Prometheus helm chart. (prometheus-community/prometheus)
- Using Prometheus Operator: This is an entire Prometheus stack, it comes with Prometheus, Altermanager, Grafana and other components. (prometheus-community/kube-prometheus-stack)
Tools and pre-requisites
- Running K8s cluster (Check my blog on minikube installation)
- kubectl: K8s client, to perform queries to K8s cluster
- helm: Package manager for K8s
Steps to connect K8s and Prometheus
Check my encountered issues before proceeding to the next steps: https://github.com/Prajwalmithun/fastapi-demo-for-medium/issues?q=is%3Aissue+is%3Aclosed
Start minikube cluster
# minikube start --memory 4096Add the Prometheus repository & update it
# helm repo add prometheus-community https://prometheus-community.github.io/helm-charts

# helm repo list

# helm repo update
Install the Prometheus Helm Charts (with default values) from the repository that I added in the previous step
# helm install prometheus prometheus-community/kube-prometheus-stackNow, helm has deployed Prometheus on the default K8s namespace. We can confirm by running the following command.
# kubectl get pods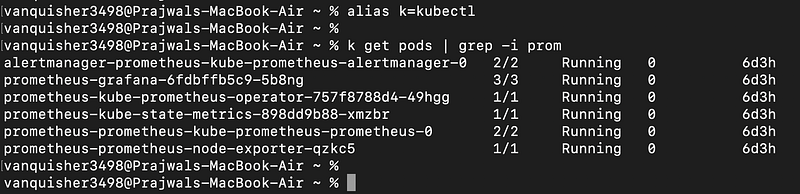
Access the Prometheus UI and Grafana UI
By default, the service type of Prometheus and Grafana is set to “ClusterIP”. If the service type is ClusterIP, we cannot access them outside the K8s cluster.
Possible ways to expose these 2 services to access from outside the cluster:
- Port forwarding using kubectl for those pods that run Prometheus and Grafana. (NOT Recommended: Inefficient when there are more than 1 replicas)
- Change the service type to “NodePort”. (In this blog)
- Ingress controller (Recommended for production)
To change the service type to NodePort, follow these steps:
Verify the service TYPE of “prometheus-kube-prometheus-prometheus” and “prometheus-grafana” by running,
# kubectl get svc prometheus-kube-prometheus-prometheus prometheus-grafanaRun this command, and edit the config of “prometheus-kube-prometheus-prometheus”
# kubectl edit svc prometheus-kube-prometheus-prometheusChange the config file to look this way. Just add/change those 2 RED highlights.
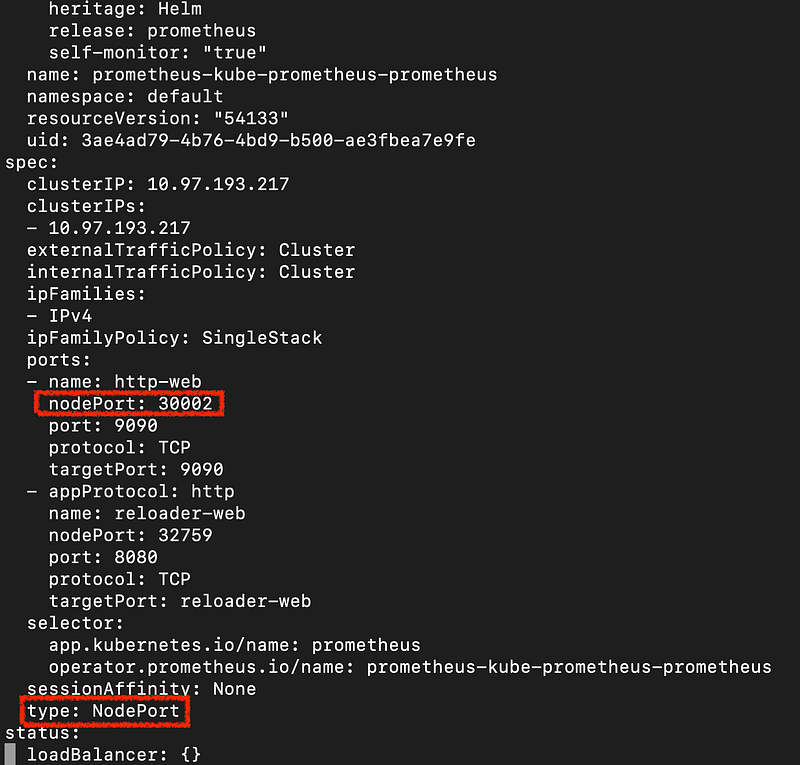
Now do it similar to “prometheus-grafana”
# k edit svc prometheus-grafanaAfter changing, your config must look this way.
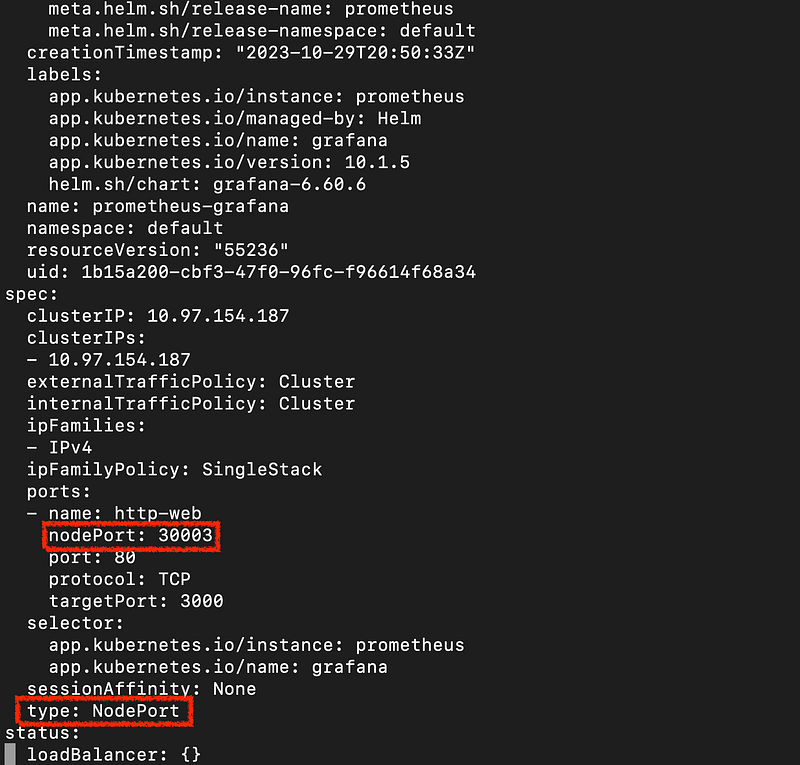
Verify if the changes are done successfully. If done correctly, the TYPE must be “NodePort”
# kubectl get svc prometheus-kube-prometheus-prometheus prometheus-grafanaNow, we have changed the service type of prometheus and grafana. We can access each of them at these endpoints:
Prometheus
http://<minikube_ip>:30002Grafana
http://<minikube_ip>:30003Run this command to know the IP address of minikube node
# minikube ipAccess Prometheus UI
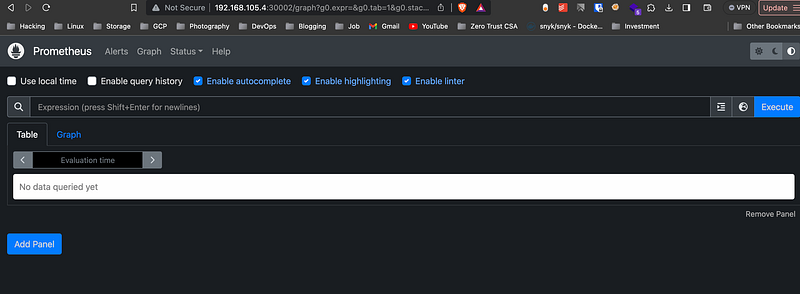
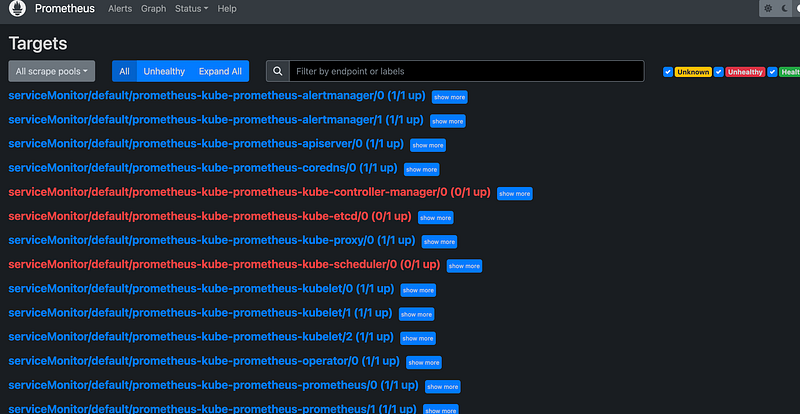
In the Prometheus dashboard, n
avigate to “Status -> Targets”. Check if there are entries about the Kubernetes components.
By running the following expression in the search box, we see the metrics related to the service called “prometheus-grafana”
{service="prometheus-grafana"}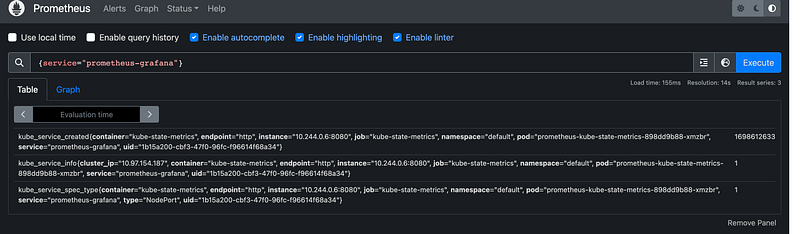
Access the Grafana UI
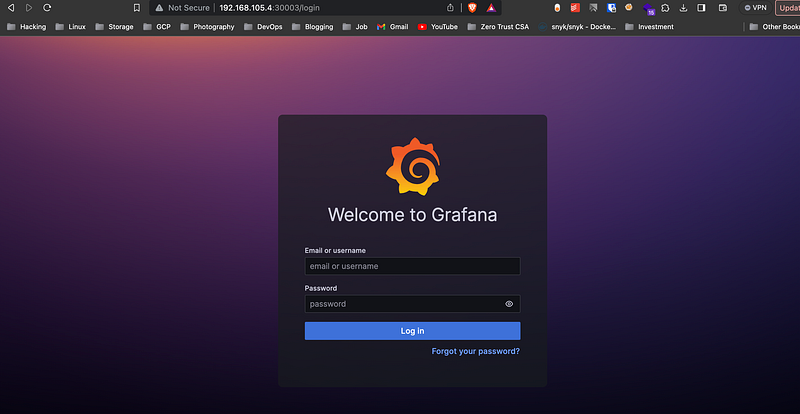
Default username/password if deployed via operator is : admin/prom-operator
This is how we can look at the metrics of Kubernetes components in Prometheus. In the next section, we will look at how to instrument an application and monitor the application metrics.
Instrument the application
Instrumenting an application in simple terms means, writing additional code (like importing and using packages, and libraries) to expose the application metrics in a format that tools like Prometheus can understand and scrape it.
- In this blog, I have used a simple API written in fastAPI.
- Source code: https://github.com/Prajwalmithun/fastapi-demo-for-medium
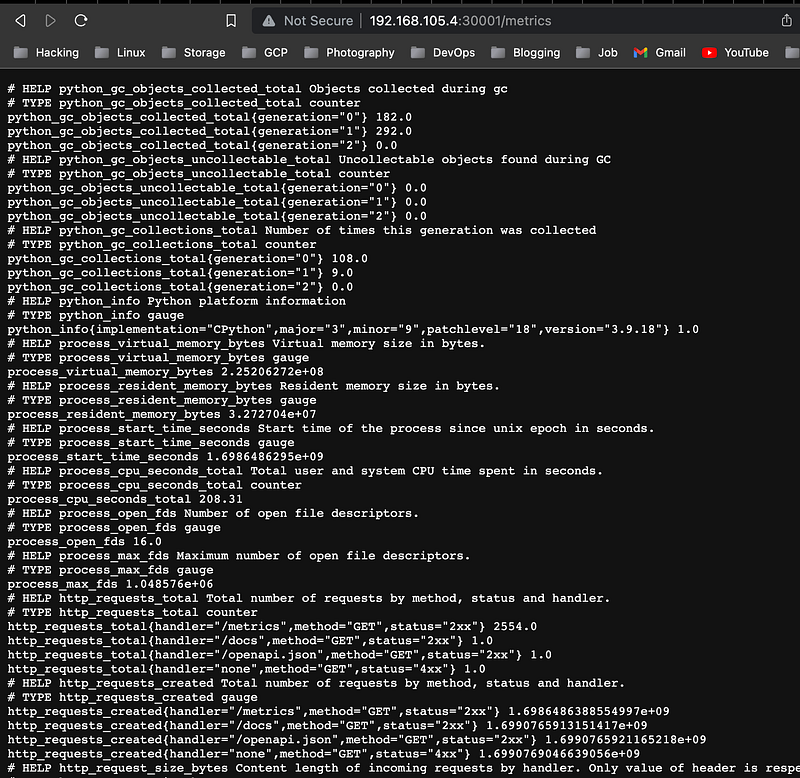
The main part of the instrument of this fastAPI is this code.
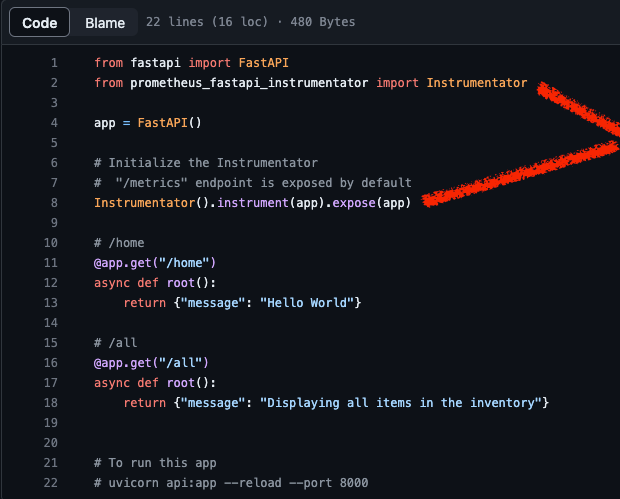
This exposes an endpoint called “/metrics”. Prometheus will scrape the application-specific metrics from this endpoint.
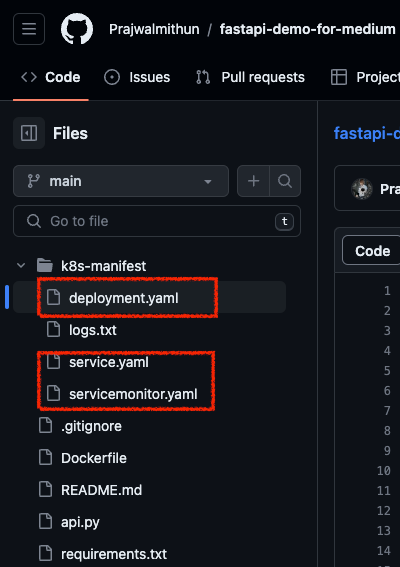
Deploy the application
To deploy the fastAPI to Kubernetes, I have created manifest files. They are under the “k8s-manifest” directory
You can clone my repository and run this command to deploy the application.
# git clone https://github.com/Prajwalmithun/fastapi-demo-for-medium.git
# cd fastapi-demo-for-medium/k8s-manifest
# kubectl apply -f deployment.yaml service.yaml servicemonitor.yaml
Access the fastAPI in your browser
http://<minikube_ip>:30001/home

http://<minikube_ip>:30001/all

http://<minikube_ip>:30001/docs

http://<minikube_ip>:30001/metrics
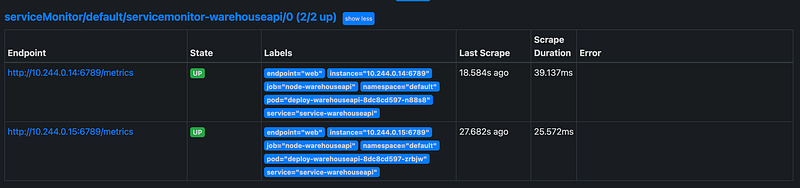
Accessing the app metrics in the Prometheus UI
- Check under targets. (Status -> Targets). Since there are 2 pods running for the fastAPI, you must see 2 entries.
- Also, run a simple query like the following to query all the endpoints that match the label web.
{endpoint="web"}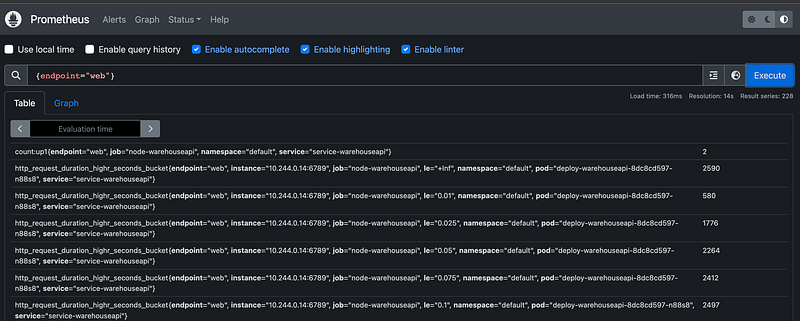
Quick access
Get the IP of the minikube cluster
# minikube ipAPI is running on port 30001
http://$(minikube ip):30001Prometheus is running on port 30002
http://$(minikube ip):30002Grafana is running on port 30003
http://$(minikube ip):30003The default username and password for Grafana is
admin/prom-operator
Issues encountered during the setup
Resources
[1] Source code
[2] Minikube installation on Mac M1/M2 chip
[3] Minikube installation on Windows 10 (I haven’t tried on Windows)
[4] Minikube installation on Ubuntu 18.04 / 20.04
[5] Helm installation


