Momentum vs mean reversion in crypto. Attempt #2
My previous post on this topic had some problems which I will try to fix in this post.
First problem is that I used 30 minute sliding window and overlapping periods to create a collection of returns. That collection was then used to sample returns for Monte Carlo simulations. The problem with this approach is that many sampled returns will have high serial correlations. This problem gets worse as the period gets longer. For example, in case of 24 hour periods it is obvious that for a given period its return will be almost identical to the next period, which is shifted by 30 minutes. The overlap between consecutive periods ranges from 50% for 1 hour periods to 97.92% for 24 hour periods. You can find more detailed explanation of the problem here.
Another issue is that random sampling of simulated returns does not allow to capture any serial correlations that might exist in the historical data. On one hand I have a collection of returns some of which have very high serial correlations, and on the other hand my sampling method isn’t suited for finding such correlations. So the results I got are likely inaccurate.
I’ve made several changes in testing procedure. First of all, I won’t use overlapping periods and I won’t use random sampling for simulated returns. Second, I will test different lengths of lookback and holding periods (previously I only tested lookback\holding periods of equal length). And third, I will use correlation coefficient as a measure of momentum or mean reversion. If there is momentum (mean-reversion) in crypto market we expect that current period returns are positively (negatively) correlated with next period returns. It is possible that some pairs of lookback\holding periods will exhibit momentum and other pairs will exhibit mean-reversion. Such testing methodology is described in E.P.Chan’s book ‘Algorithmic trading: winning strategies and their rationale’.
I will use the same data as in previous part: close prices of 25 coins in 30 minute intervals from 01.07.2021 to 22.11.2021. The list of coins is provided below.
['BTC', 'ETH', 'BNB', 'XRP', 'DOT', 'DOGE', 'SHIB', 'LTC', 'UNI', 'LINK', 'MATIC', 'BCH', 'TRX', 'MANA', 'ATOM', 'ETC', 'XTZ', 'XMR', 'GRT', 'EOS', 'SAND', 'AAVE', 'LRC', 'NEO', 'ZEC']Let’s get started.
First I’m going to test the overall crypto market represented by 25 coins in my dataset. I will test all possible combinations of lookback and holding periods, where lookback period is at least as large as holding period (I don’t think it makes sense to test holding periods longer than lookback period). So for each pair of periods I need to calculate returns during lookback period and returns during the corresponding holding period (which starts immediately after lookback period).
Then I will select top 3 winners\losers in each lookback period and check how their performance in the lookback period correlates with their performance in the following holding period.
The method for avoiding overlapping intervals described in E.P.Chan’s book puzzles me. Below is the picture from the book along with a quote.
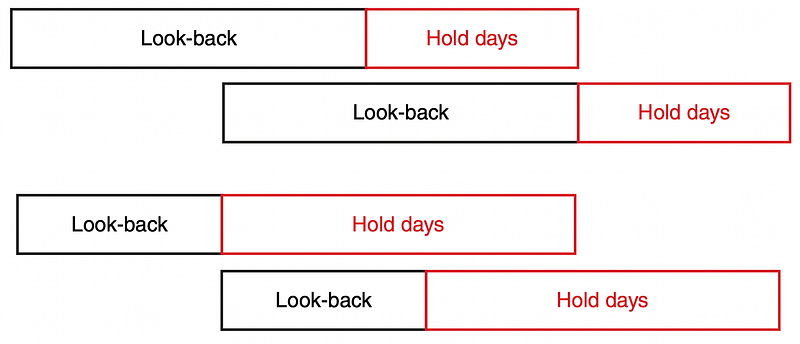
In computing the correlations of pairs of returns resulting from different look-back and holding periods, we must take care not to use overlapping data. If look-back is greater than the holding period, we have to shift forward by the holding period to generate a new returns pair. If the holding period is greater than the look-back, we have to shift forward by the look-back period.
I understand why the periods in the bottom are considered non-overlapping, but the periods on top of the picture look overlapping to me. Especially this would be noticeable if the holding period is significantly shorter than lookback period.
Since I’m not certain which shift period to use I will perform two tests. In one I will shift forward by holding period as suggested in the book (my holding periods are always less than or equal to lookback period). In another I will shift forward by lookback period.
I will start with the method described in the book: shifting by holding period. First I test the whole market. The python code for doing it and the results I got are provided below.
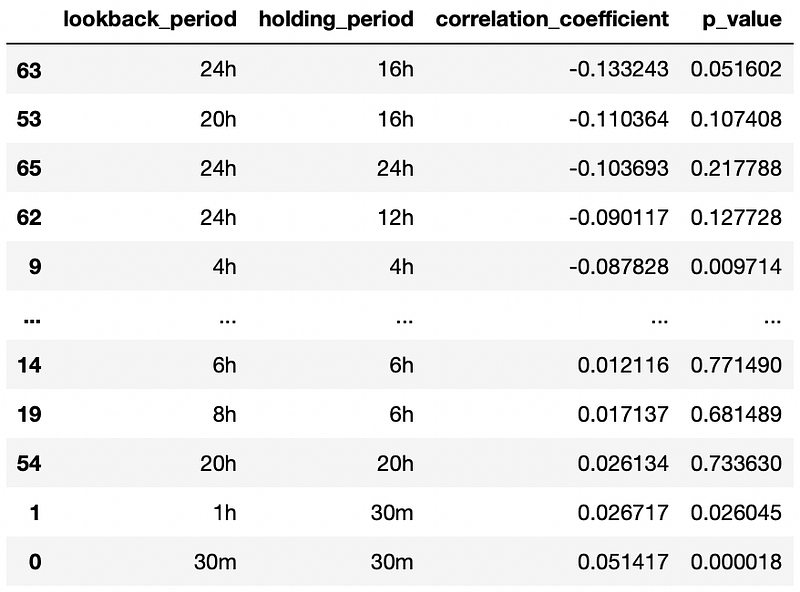
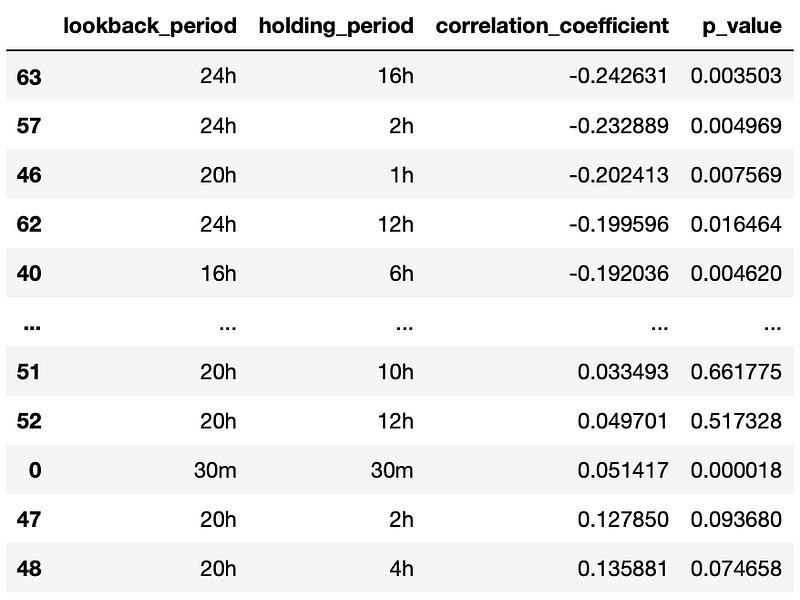
Results in the table above are sorted by correlation coefficient. As you can see, the highest correlation coefficient is approximately equal to 0.05 (between consecutive 30min returns). It is very low and indicates that there is no momentum in the overall market. Mean-reversion is a little bit more pronounced which is indicated by correlation coefficient of -0.13 (which is still very close to 0) for 24h-16h time frame.
Now I will perform the tests for top 3 winners\losers. Source code is provided below.
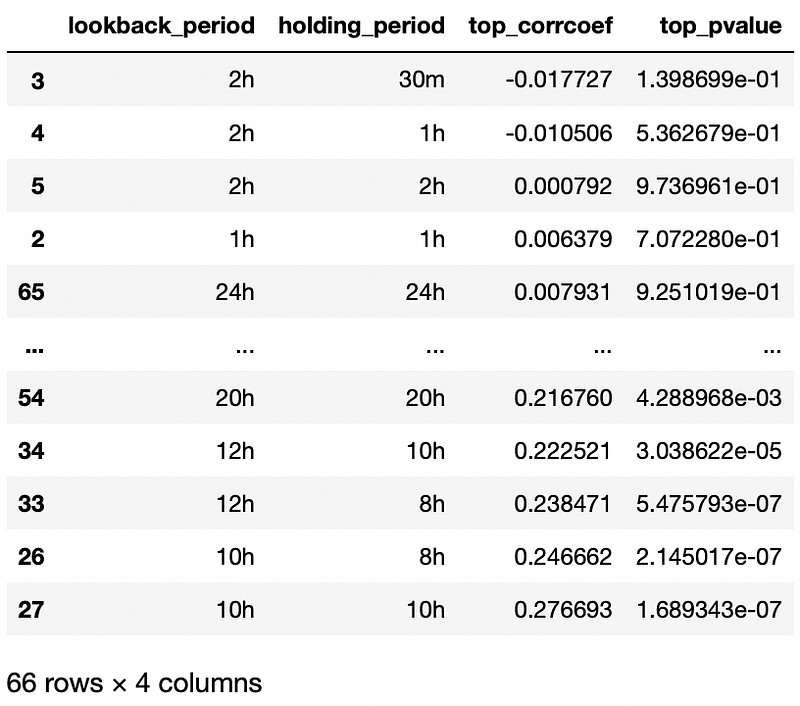
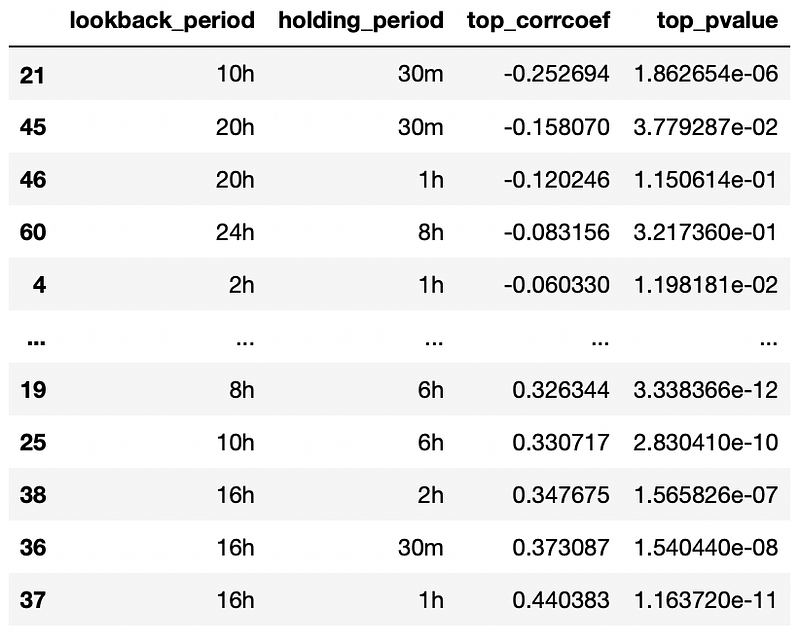
First let’s look at top 3 winners. The biggest correlation coefficient is 0.27 for 10h-10h time frame. This is a lot bigger than 0.05, which we got for the whole market. Also note that almost all correlation coefficients are bigger than 0. This indicates the absence of mean-reversion for best performing coins. Next we will look at worst performing coins (top 3 losers).
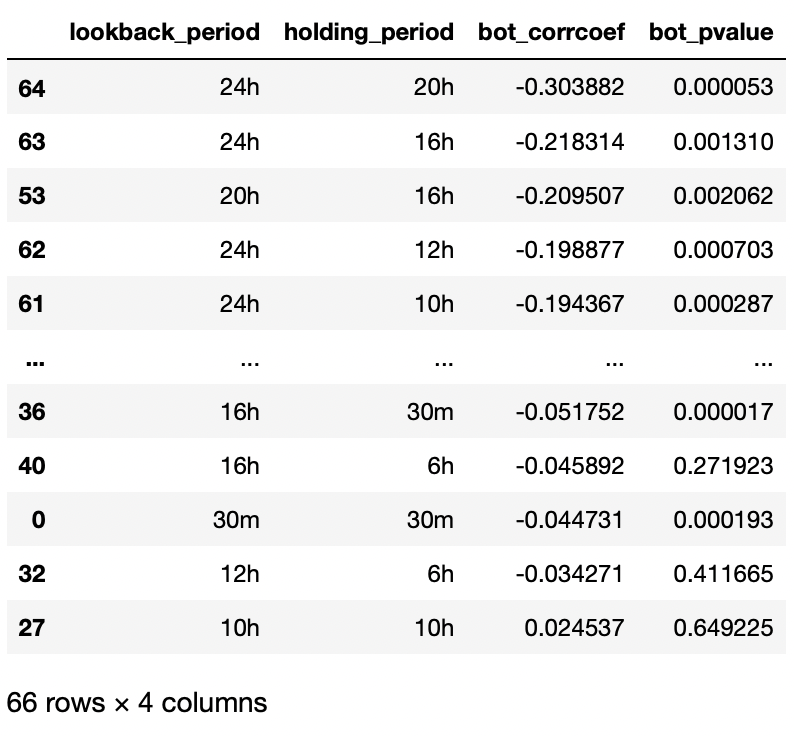
Here all correlation coefficients except one are negative, which indicates the absence of momentum. For 24h-20h time frame we get correlation coefficient of -0.3, which points to mean-reversion.
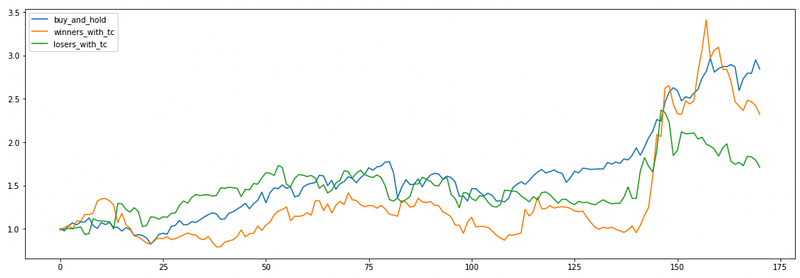
These results suggest the both momentum and mean-reversion are present on different time frames. On 10h-10h time frame we should buy the winners, on 24h-20h timeframe we should buy the losers. Let’s try to backtest these strategies. I will also calculate the returns of simple buy-and-hold strategy — buying equal dollar amounts of each cryptocurrency at the beginning of the backtest period and holding it until the end. The source code and results are provided below.
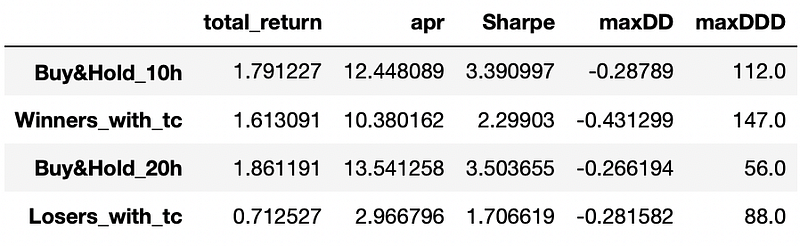
You may notice that the metrics of buy-and-hold strategies are different. This is because of different starting and ending times for 10h-10h and 24h-20h strategies. Also note that maximum drawdown duration is measured in holding periods. So for example the drawdown duration of buy-and-hold strategies is exactly the same (112*10 = 56*20), which is expected. Overall we can see that buy-and-hold strategy outperforms our algorithms in all metrics.
To plot the returns I need to resample 10h-10h strategy to have the same amount of observations as 24h-20h strategy. I will use every second observation from 10h-10h strategy and remove a couple of first and last return periods. The returns I get won’t be exactly aligned with each other, but for plotting it’ll be ok.
One thing to note is that I assumed one-way transaction cost of 0.2% and that at each period we fully liquidate our old position and after that enter new position. This results in 0.4% total transaction cost. This cost can be lowered if there is some intersection between consecutive positions. Lowering transaction costs can significantly improve the performance of the algorithm.
Let’s perform similar tests, but shifting forward by lookback period each time. If the holding period is shorter than the lookback period we would need to wait a certain amount of time to open a new position after the end of the holding period. This probably doesn’t make sense in terms of real trading strategy, but we would have non-overlapping lookback periods. Overall we will have less observations, but the observations would be less correlated with each other. This can give us more robust results.
Again I start by testing the overall market. Code and results are below.
The results are quite similar to what we got before. There is no indication of momentum and a slight indication of mean-reversion. Let’s try testing winners and losers.
Here we get bigger correlation coefficients for certain time frames. But note that the biggest correlation coefficients correspond to very short holding periods. I think that returns during such short periods won’t be enough to cover transaction costs. Testing 10h-6h, or 8h-6h strategies for winners might be interesting. Although their correlation coefficients are only a little bigger than 0.27 we got before, but they provide almost twice as much trading opportunities as 10h-10h strategy.
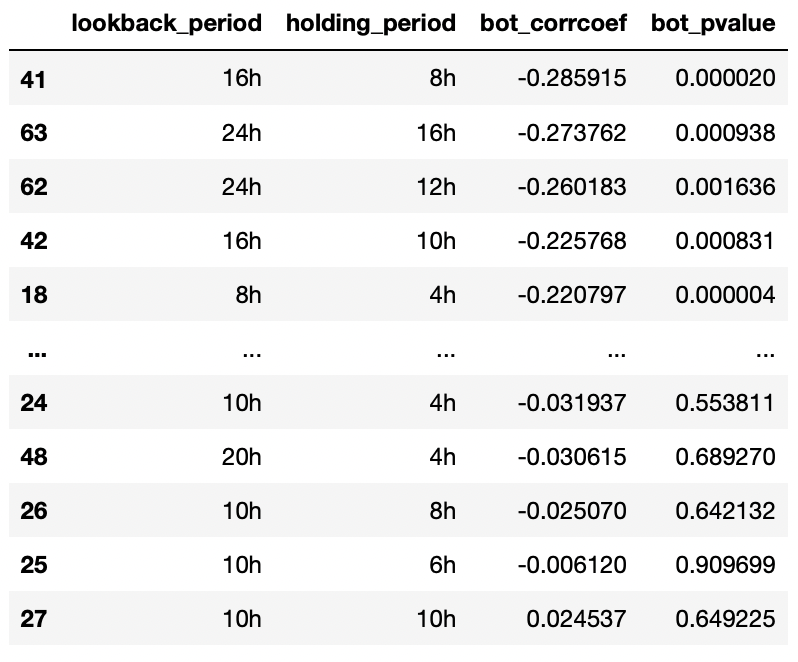
For top3 losers we again see that there is no momentum, only mean reversion. 16h-8h strategy might be interesting to test, since it will also provide a lot more trading opportunities compared to 24h-20h strategy I tested above.
I will not perform any backtests here. Interested reader can easily modify the code provided above to backtest any other combinations of lookback and holding periods.
Further improvements:
- Perform out-of-sample test of the same strategies.
- Try testing correlations between signs of the returns in consecutive lookback-holding periods instead of returns themselves.
- Try some techniques of modelling returns to increase sample size.
- Implement different tests of return dependence.
Jupyter notebook with source code is available here.
If you have any questions, suggestions or corrections please post them in the comments. Thanks for reading.


