
Minimizing CO2 Emissions in Riyadh City
Minimizing CO2 Emissions in Riyadh City
Supervised By : Kerim Mehmet Murat Tunç
Group Members:Lana Abu Hasna,Abdallah Abu Laila,Homam Othman,Oguzcan Acar
Abstract
This paper aims to investigate different technologies and potential alternative solutions to determine the amountof carbon dioxide emissions released by the city of Riyadh and to identify ways of minimizing the amount of carbon dioxide emissions that are determined to have been produced by the city of Riyadh. According to the results of the calculations, the total carbon dioxide emissions in the city of Riyadh is 120.89 Mt (Mt=106 t) CO2 , and power plants representing the most major contribution compared to the other major sources of emissions in the city. The emissions caused by power stations primarily run-on fossil fuels total 120.77 Mt CO2. As a direct consequence of this, many alternate solutions for reducing the city’s carbon emissionshave been developed.
Introduction
Urbanization and urban development accelerated CO2 emissions, despite that fact, CO2 isan essential element in the formation of the atmosphere to keep the earth from freezing. However, CO2 levels increasing above the natural range have a negative effect on the environment such as global warming, melting snow and increasing ocean levels, forest fires and the overall effect on human health. Countries have conducted studies to calculate the amount of carbon dioxide in theatmosphere from different sectors and fields to be able to find solutions, technologies, and strategies to reduce CO2, such as carbon capture and storage (CCS) technology, which is used byone of the most famous oil companies in the world, the Saudi company Aramco. There is applying smart grid electric applications to reduce CO2 emissions from the electricity and energy sector.
The city of Riyadh, and the Kingdom of Saudi Arabia are distinguished by their global leading role in oilexports, and their place coming after Russia in production of crude oil. This emphasizes the importance of usingtechnologies to reduce CO2 emissions and capturing them before they enter the atmosphere, while also providingadequate amounts of energy for domesticusage and global exports.
This study contains three main sections, which are calculating the amount of carbon dioxide emitted fromdifferent sectors in the city of Riyadh, such as cars, airplanes, air conditioners, power plants etc. It also contains suggested technologies to reduce these emissions, which have been calculated using previous formulas, and non-technological methods used by the governmentto strategize the reduction of emissions. The aim of this study is to carry out comprehensive research about Riyadh and its emissions, so to provide insight on one of the leading countries in oil exports.
Scopes Of Carbon Emissions
The most extensively used international accountingmethod, divides carbon dioxide and other greenhouse gases such as carbon dioxide into three categories or “Scopes.”. The scopes of carbon emissions (Greenhouse Gas Protocol, n.d.)
Scope 1 includes emissions from sources that an organization directly owns or controls. Scope 2, emissions are those caused indirectly by a company when the energy it purchases and uses is emitted. Scope 3 includes emissions that aren’t created by the company and aren’t the result of actions from assets owned or controlled by it but are caused by those who are indirectly accountable for the company’s emissions up and down its value chain.
Methodology
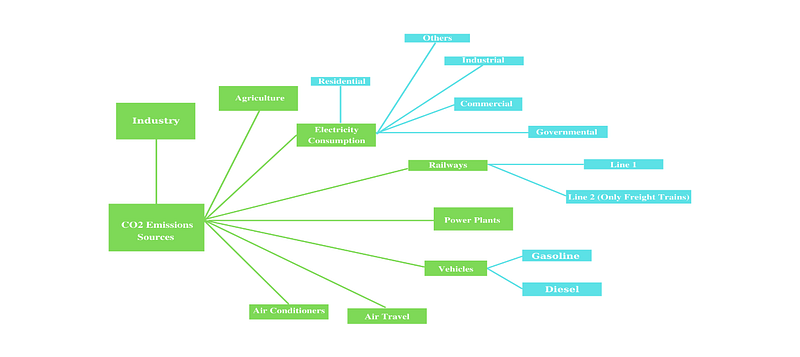
The yearly emissions rates of the city were divided into 10 categories to develop solutions for limiting carbon emissions in the city of Riyad. The sources of carbon emissions are categorically shown in Figure 1 in the following order: electricity consumption, power plants, railways, vehicles, industry, agriculture, air conditioning, and air travel.
Data Collection For Major CO2 Emissions Sources
The CO2 emission sources and amount of the city of Riyadh are calculated for the specified sections
Electricity Consumption
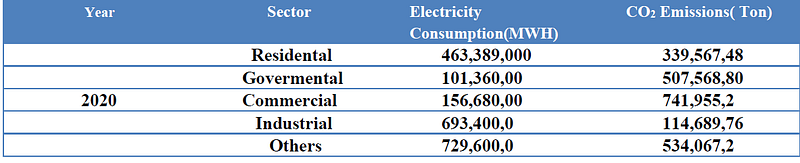
Saudi Arabia’s power consumption data is divided into regions by data provider. The scope 2 category includes the amount of carbon dioxide that is indirectly released into the environment consequently from using electricity. (Electricity Consumption by Sectors, 2022). The amount of CO2 emissions from energy consumption is computed using Equation 1 (rewritten) and is shown in table 1 along with the sectors’ electricity usage in 2020.

The emission factor (EF) used to calculate carbon emissions in energy consumption varies by country; for Saudi Arabia in 2020, it was found to be 0.732 kgCO2 e per kWh. (Carbon Footprint, n.d.) Equation 1 is rewritten as follows on expressing the result in tons.

The total carbon dioxide emissions due to the consumption of electricity in 2020 are 108,942,828 CO2 tons.
Power Plants
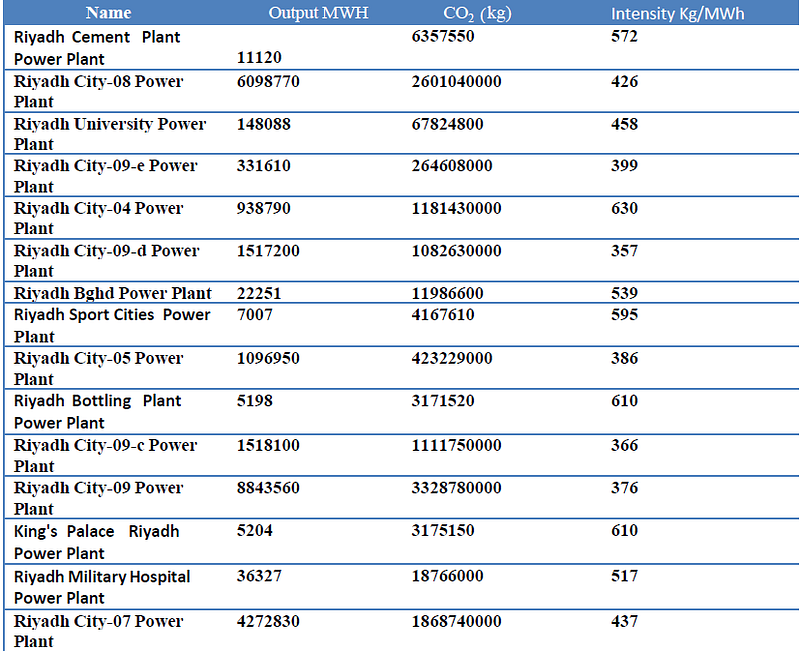
The majority of Saudi Arabia’s energy is generated by fuel. Mainly fossil fuels are used to generate energy in power plants. (Open Infrastructure Map, n.d.). While fossil fuels are widely used, their carbon emissions are vented directly into the atmosphere and are classed as scope 1 emissions. There are 16 different power plants in Riyadh. The table 2 below lists the output generation, carbon dioxide emissions, and carbon density statistics for the power plants. (Saudi Arabia Powerplants Output, CO2 and Intensity, 2017)
Railways
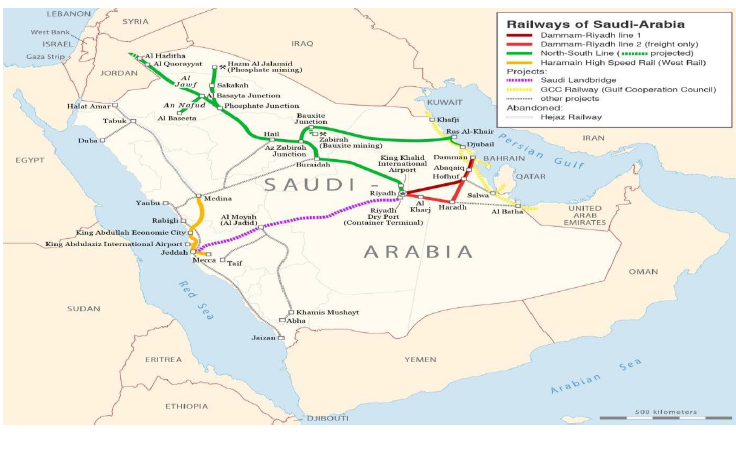
The railway network is divided into 2 main lines. The rail network named line 1 shown in the figure is for passenger trains. Intercity train models are used to transport passengers on the rail network, which is shown as Line 1. The other rail network named line 2 is for freight trains only. (Wikipedia contributors, 2022)
The distance between the stations, the number of passengers at each stop, and the weight of the cargo transported must all be known in order to determine the quantity of carbon dioxide emissions produced by trains. The table 1 below shows the distance between Riyadh-Dammam Port Stations based on Kapsarc data collected in the range. (Distances Among Railway Stations, 2022) In Table 4, the total number of passengers carried by the railwaysin 2019 and the freight transported are given in tons. (Railways’ Passengers, Freight and Revenues,2022)


Calculating the carbon dioxide emissions in railroads requires two equations. These equations are appropriate,and the GHG Protocol defines the values for carbon dioxide emissions. For passenger trains, the equation 2 is employed, and for freight trains, the equation 3. (Technical Guidance for Calculating Scope 3 Emissions)
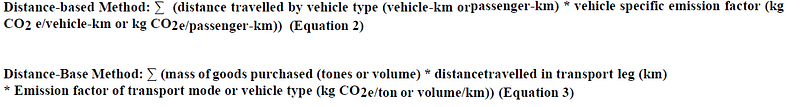
The emission factors determined by the GHG Protocol for trains are given in the table 5. (Calculation Tools | Greenhouse Gas Protocol.) The carbon dioxide emission quantity of the railways was found in kg in the table below due tothe emission factors required for the formulas and the data of the railways

Consequently, the emission amounts and the overall emission amount in the railways are shown in the table 6 when line 1 and line 2 are determined using equations 2 and 3.

Vehicles
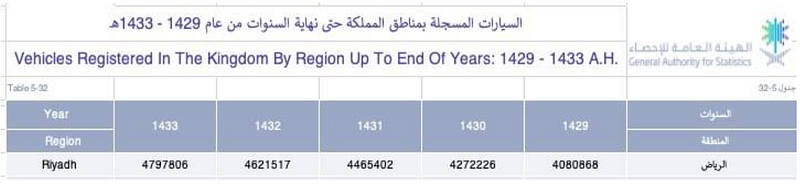
Studies that have been done by the Saudi Arabian General Authority for Statistics in 2012 revealed that there were 12,785,764 vehicles registered across the country, with 4,797,806 of them in the Riyadh region. Table 7reveals the total number of vehicle registrations.
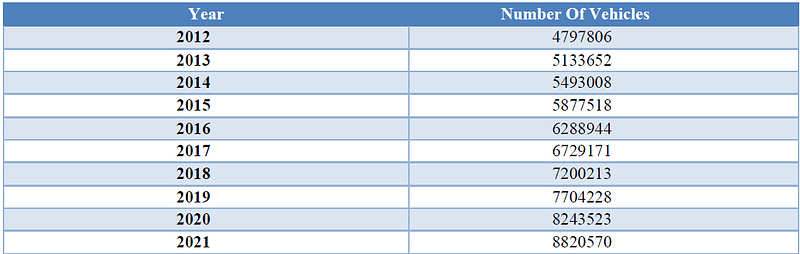
Since 2012, the number of automobiles in the city has climbed by 7% annually, reflecting the fact that residents of the wealthy city of Riyadh often drive individual vehicles. The rate of rise by years is shown in Table 8.
The transportation sector constitutes one of the three largest energy consuming sectors in Saudi Arabia, along with the buildings sectors, which consume about 30% and industry about 41%, according to recent statistics. According to the Saudi energy efficiency centre, gasoline-fuel basedautomobiles accounts for 83% of the vehicles in the kingdom, 11% diesel-fuel based and 6% electrical vehicles. In order to calculate the carbon emissions from cars in the city of Riyadh, the number of cars must be divided according to the type of fuel. (Chapter 14 | Transportation,2019)]
Gasoline For Vehicles
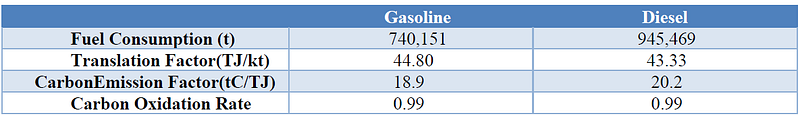
According to estimates, Saudi Arabia’s transportation industry consumes 4,591,505 tons of gasoline and and the amount of gasoline consumption used for vehicles in the country is 2,387,583 tons. There are 18,233,708 vehicles in the nation that use gasoline, while there are 6,837,640 vehicles using the same sort of fuel across the entire city of Riyadh. Saudi Arabia consumed 2,387,583 tons of gasoline in 2020 and 740,151 tons of fuel in Riyadh. This section contains equations 4,5,6 and 7(Gümüşhane Üniversitesi Fen Bilimleri Enstitüsü Dergisi)
The energy consumption must be estimated in order to determine the quantity of carbon emissions using the data acquired. Energy consumption for gasoline was calculated using equation 4 and found to be 33,159 TJ.

The carbon content was then calculated using Equation 5, and the outcome was 626,705 tC. After calculating the carbon content, its conversion to t was Equation 6 and its value was 626,705 Gg.
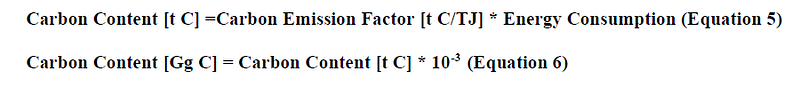
The final step to determine the amount of carbon emission utilizes it in addition to Equation 7. Utilizing equation 7, the result is 620.44 GgC.

The calculation of carbon emission also needs to be multiplied by the molecular weight ratio of CO2. The carbon emission amount for Gasoline is 2.275 Gg CO2.
Diesel For Vehicles
In 2020, Saudi Arabia utilized 25,755,840 tons of oil equivalent worth of diesel. 5,865,191 tons of diesel are used in Saudi Arabia’s transportation sector, while 945,469 tons of gasoline are utilized there for motor vehicles.In the country, there are 2,416,516 diesel-powered automobiles, whereas in Riyadh alone, there are 906,193 diesel-powered vehicles. In 2020, Saudi Arabia used 38,953 tons of diesel and 945,469 tons of diesel. In order to calculate the amount of emissions in diesel consumption of vehicles, the formula in section 3.1.4.1 should be used again and the result obtained is 0.1236 Gg CO2.The result indicates that the vehicles’ total CO2 emission amount is 2.3986 Gg CO2.
Industry
In Riyadh, according to calculations, there is a total of 2870 factories in the capital. With a rough average of 23,007 tCO2 emissions per factory, a total of 66.03 million tCO2 is emitted. There is always ongoing research and efforts to reduce carbon emissions, which always results in improvements in the carbon situation in Riyadh.
Agriculture
Riyadh, and Saudi Arabia in general, don’t have a lot of agricultural activity. Since most of the carbon emissions come from industry and means of transportation, agriculture accounts for only 4% of total carbon emissions in the country.
Air Conditioners
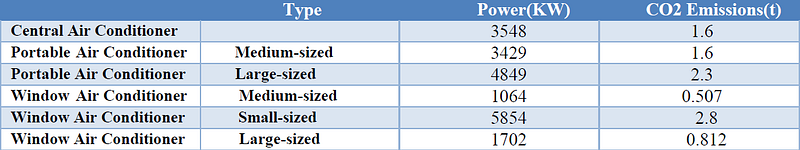
Riyadh and the Kingdom of Saudi Arabia in general is known for its high temperatures, which reach 45 degrees Celsius in the summer. (Carlson, 2019) Due to these conditions, the people use air conditioners heavily and for many hours at 60% of electricity consumption is due to air conditioners. (How Much Power Does an Air Conditioner Use? 2022).There aremainly 3 types of air conditioners, CentralAirConditioner whichuses between 3000 watts per hour, Portable Air Conditioner (Medium-sized) use an average of 2900 watts per hour and the (Large-sized) can consume about 4,100 watts per hour, finally theWindowAir Conditioner (medium-sized) uses 900 watts per hour, (small-sized) uses 500 watts perhour while larger units use 1440 watts. For the calculations, assumed that in each house in Riyadhthere are 2 air conditioners, population equal to 6505509 and the persons per household 5.6,thus 1161698 then the share of households that have air-conditioning in Saudi Arabia 63% (2016), calculations if the AC works for 8 hours. (How-many-watts-does-an-air-conditioner-use, n.d.)
The energy usage for each type of air conditioner in this scenario and the emission from the air conditioner is determined using Equation 8, and the results are shown in Table 8. Total CO2 emissions are 9.619 T.

Air Travel
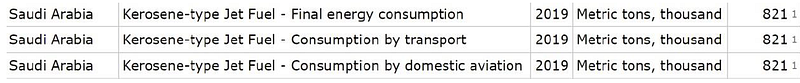
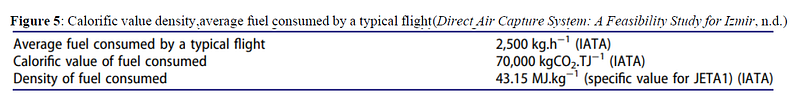
The carbon emissions from domestic and international aircraft in the city of Riyadh were calculated using equation 9. The total fuel, the emission factor, and the calorific value of the fuel are multiplied to determine the total emission resulting from the fuel consumption of the flights. Some specific values to find net worth are given in the table below. The amount of fuel used must also be known to continue calculating the aircraft’s carbon emission. The figure below shows the fuel amount. (UNdata, n.d.)
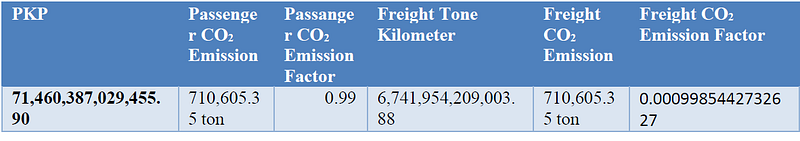
Two categories are used to calculate the aircraft’s carbon emissions. The first is the carbon emission generated by the passenger, and the second is the carbon emission caused on by the movement of freight. The total number of flights, passengers, and embarkations at King Khalid International Airport in Riyadh are shown in the table 9 below for the formulas to be fully applied. (Air Traffic in the Kingdom’s Airports According to the Operator, 2022) The following formula is used to calculate emissions from passengers. Equation 9 is applied to calculate the passenger per kilometer parameter, and equation 10 is used to obtain the freight per kilometre parameter.(Stakeholder Consultation) The table includes all values that were obtained. The aircrafts emit 780885 t CO2 total when the carbon emissions from passengers and cargo are combined


Technologies For Reducing CO2
CO2 Capture
Carbon capture and storage (CCS) is a new game changing technology in a world that runson carbon-producing technologies. It is the method in which carbon goes through uptake before itenters the atmosphere and stored in a safe place away from the environment where it contributesto global warming. It enables the world to meet its energy needs while also minimizing the damagecaused by carbon emissions. This paper talks about stakeholder views towards CCS and aims to analyse the multiple facets of it.
Strategic Context
SaudiArabia’s oil industry has played an important role in its socio-economic development.As of 2010, Saudi Arabia was the world’s largest producer and exporter of liquid petroleum products and the second largest crude oil producer in the world after Russia. Saudi has a capacityof producing 12.5 million barrels per day, which accounts for 80% of budget revenues, 45% of GDP, and 90% of export earnings at 6–7 million barrels per day.Oil can help Saudi Arabia grow over the next few decades, but from a strategic point of view, sustainable development, primarilyby selling commodities, is not possible. In light of this, the Saudi Arabian Oil Company (Saudi Aramco) has launched a major initiative aimed at transforming an oil and gas company into a fully integrated global energy company as a key component of the Kingdom’s economic development. Saudi Arabia’s CO2 emissions, which are primarily caused by the combustion of oil and natural gas, are rapidly increasing. Saudi Arabia’s CO2 emissions, which are primarily caused by the combustion of oil and natural gas, are rapidly increasing. Saudi Arabia’s CO2 emissions from fuel combustion are tiny in comparison to the United States, China, and India, accounting for only 1.4 percent of world CO2 emissions in 2009. Saudi Arabia has some of the greatest per capita CO2 emissions in the world, with 16.2 t CO2 per person. CO2 emissions per person in the Middle East, the OECD, and the world, on the other hand, are 7.8t, 9.8t, and 4.3t, respectively. Although other variables (such as land area) and climate (such as the desert environment) influence energy use, the relatively high amount of CO2 emissions per capita underscores the need to decouple CO2 emissions from economic growth in Saudi Arabia.
Review of CCS in Saudi Arabia
CCS has sparked increased attention in the MENA region in recent years. CCS, accordingto Saudi Arabia, should be included in the Clean Development Mechanism (CDM), which allows developed countries to offset their emissions. Saudi Arabia’s current CCS operations are mostly focused on basic technical and policy research. CCS is mostly addressed by professionals and keyparties. The King Abdul-Aziz City for Science and Technology (KACST), King Fahd Universityof Petroleum and Minerals (KFUPM), King Abdullah University of Science and Technology (KAUST), Saudi Aramco, and the King Abdullah Petroleum Studies and Research Center are all involved in CCS research in Saudi Arabia.Within the oil industry, Saudi Aramco has been actively involved in carbon management programs. CO2 capture (mobile capture, oxy-fuel combustion, andchemical looping combustion) and storage are all part of a complete research framework for CCS.
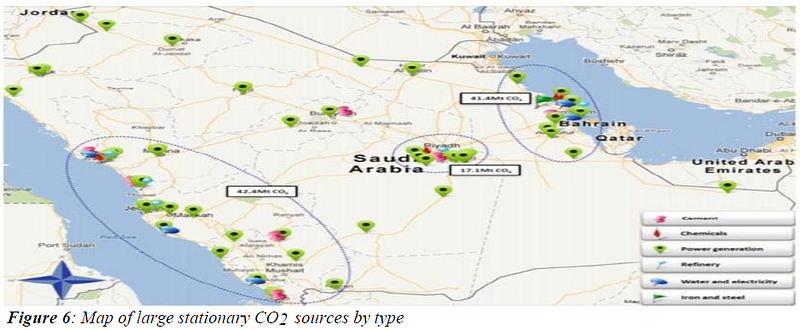
99 major CO2 point sources in Saudi Arabia, each of which emits between 100,000 and 8,000,000 t of CO2 year, are shown in Fig. 8. CO2 emissions from these sources are anticipated to total 113 MtCO2 per year. The majority of the sources are centered around the Red Sea and Arabian Gulf coasts of Yanbu, Jeddah, Jubail, and Dammam, with roughly 36% of emissions on the west coast, 43% on the east coast, and 21% in the middle region. This indicates huge prospects, as it connects a variety of different systems to create a network of emitters in proximity via onshore pipes clusters of CCS, which would benefit from the ability to share the substantial costs of CO2 capture, compression, transportation, and subterrain storage. (Saudi Aramco Joins World Bank’s Initiative: ‘Zero Routine Flaring by 2030,’ 2019)
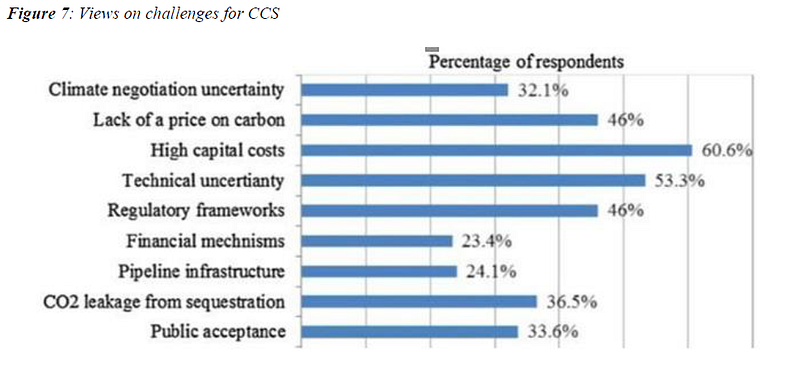
Figure 7 depicts the main hurdles for an integrated large-scale CCS demonstration in Saudi Arabia. “High capital costs” is seen by the majority of respondents (60.6%) as the most problematic feature of CCS demonstration at scale in Saudi Arabia. Moreover, half of respondent’s regard “technical uncertainty” as the second most challenging barrier (53.3 percent). Even while most oil and gas stakeholders are familiar with separate technologies, they are nonetheless sceptical of an integrated CCS project. The complete CO2 collecting, transport, and storage chain must be shown on a commercial scale to instill investor confidence and promote continuous learning by doing, which will reduce costs and make CCS more competitive with other mitigation technologies. In addition, slightly less than half of respondents (46%) identified “lack of a carbon price” and “regulatory frameworks” as significant barriers to the implementation of large-scale integrated CCS in Saudi Arabia. This is acceptable since no corporation will incur the extra expense of constructing a CCS facility unless CO2 emissions are economically costly. A comprehensive legislative and regulatory framework is a practical means of assuring the long-term security of CO2 storage. Dealing with the difficulties of “CO2 leakage from sequestration,” which 36.5% of respondents believe to be a significant obstacle, is also crucial. 33,6 percent of respondents felt that public acceptance is a significant challenge.
Result
The oil industry is particularly vulnerable to trade, and Saudi Arabia relies largely on oil exports, which make for most of the government’s revenue. CCS has the potential to assistthe Saudi government in its efforts to develop new energy technologies and diversify the economyaway frompetroleumin a carbon-constrained world. Combining EOR and CCS hasthe potential to be a win-win solution to the difficulties of rising domestic energy demand and climate change policies, increasing oil output while lowering CO2 emissions.
The Saudi government is currently focused on energy efficiency, renewable energy, and nuclear energy, and has initiated substantial projects in support of all three. CCS is mostly debated amongspecialists and major stakeholders. There are currently no stated plans to construct integrated large-scale CCS demonstrations, except for Saudi Aramco’s CCS-EOR demonstration. The knowledge acquired from this demonstration project will aid in the refinement of Saudi Arabia’s carbon management strategy
On Saudi Arabia’s west and east coasts, the majority of CO2 sources are centred near Yanbu, Jeddah, Jubail, and Dammam. This provides a particular advantage for the development of CCS clusters, which would benefit from a common infrastructure. Saudi Arabia also has a lot of potential for CO2 underground storage, and most of its land is ideal for it. In the lack of a clear global and local policy and regulatory framework for CCS, a realistic policygoal for Saudi Arabia currently is to demonstrate the commercial viability of CO2 capture, transport, and storage with EOR on a large-scale in a fully integrated chain
Carbon capture utilization and storage (CCUS) in Aramco
Aramco is uniquely suited to advance the technologies needed to fix the global emissions problem as the it is the world’s biggest integrated energy and chemicals corporation. It is one of the lowest emitters in the sector because of its´ revolutionary low-carbon practices and technology.Carbon capture, utilization, and storage (CCUS) will be critical in worldwide attempts to cut emissions while assuring the world’s continued viability. It works when CO2 emissions are captured at the source or straight from the air using CCUS devices. CO2 emissions are then eithermoved underground or converted into valuable goods. Carbon capture was applied for ages, but technology enabled us to collect CO2 forever. new methods to add value to waste CO2 are by converting it into valuable industrial products by pre-combustion, post-combustion, or oxy- combustion, CO2 is absorbed from exhaust or reformed gases or stationary sources. Other carbon capture methods include sequestration, which captures CO2 in geological formations. Enhanced Oil Recovery involves obtaining oil from oil fields by altering the oil’s inherent qualities, and useinvolves directly utilizing collected CO2. CO2 is captured from mobile sources and stored using mobile carbon capture devices. CO2 is captured directly from the atmosphere and sequestered or used in Direct Air Capture techniques. CO2 is extracted and stored from biomass using Bio EnergyCarbon Capture and Storage. Finally, nature has the ability to serve as a carbon sink.Aramco is also working on additional nature-based alternatives, such as creating algae ponds andphoto bioreactors, which are projected to eliminate tons ofCO2 emissions throughout its facilities.Aramco collaborates with many of the world’s major energy firms to discover practical solutions to climate change as a founding member of the Oil & Gas Climate Initiative (OGCI).
Reducing Carbon Dioxide Emissions from Electricity Sector Using Smart Electric Grid Applications
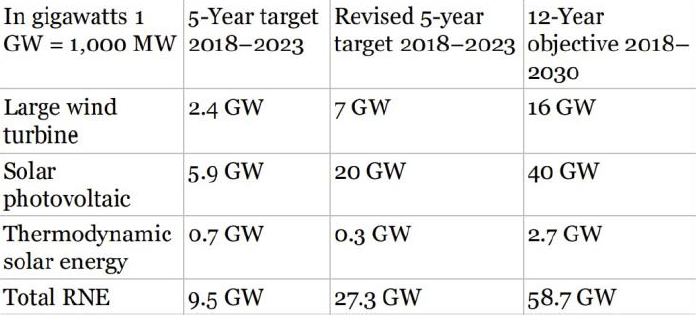
A smart electrical system includes one that uses renewable energy sources rather than fossil fuels. Saudi Arabiahas rich resources in fossil fuels throughout the country, it also evaluates the energy need across the country with fossil fuels. Energy production has increased thekingdom’s population and income per capita. The Kingdom has restricted oil production due to some international agreements and protocols. Although the restrictions limited oil production andthe rate of fossil fuel use, the country’s per capita income was not affected, and the carbon dioxideemission rate continued to rise over the years. Efforts are being made to reduce the amount of carbon dioxide emissions worldwide. On maintaining the prosperity stemming from oil and derivatives production in Saudi Arabia and reducing carbon dioxide emissions, Vision implemented the plan in 2030. The plan is to increase theuse of renewable energy sources by reducing the amount of fossil fuel use in energy production in general. The country has a significant potential for renewable energy in terms of solar and wind. With the potential it has, the country plans to achieve the goals shown in the table below with the Vision 2030 plan.(Boisgibault, L,2020)
In 2018, the city of Riyadh asked for technological information on reducing carbon emissions to establish a nuclear power plant that produces more than 1 GW of electricity. The main reason forthe city’s request for this information is to build 16 reactors producing 17 GW by 2040. Nuclear power plants that are wanted to be built in the city are not the only solution to reduce the amount of carbon emissions. There are some areas determined by REPDO, especially in the region wherethe city of Riyadh is located and throughout the country. These areas are designated for power plants that use renewable energy sources to generate energy. As seen in the map below, the city has significant solar power potential. ( Boisgibault, L,2020)
Reducing CO2 Emissions with Solar Power Plant
It takes a while to determine the capacity factor of a solar power plant since there is not enough information.However, if a solar power plant is built with a capacity factor of 10 MW, information about its daily energy production, size, and number of solar panels will be known. The table below contains the computations’ outcomes. ( Deeb, A,2019) Solar panels in solar power plants are generally changed at intervals of 5 or 10 years. If the operating period of the power plant is counted as 10 years
Equation 12 is used to determine the solar power plant’s reduced carbon emissions since renewable energy sources have a net carbon emission rate of zero. (Guidelines for Estimating Greenhouse Gas Emissions of ADB Projects, 2021)

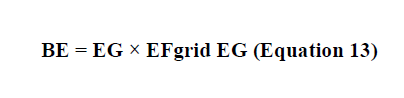
To fully use equation 12 first, the baseline emission value of the solar plant must be determined, and equation 13 is utilized to determine the value.When the annual output of the solar power plant is computed and multiplied by the specified emission factor, the baseline emission of 6019 t CO2 / year is obtained. Project emission in Equation 13 is counted as 0 renewable energy sources. Therefore, if the solar power plant is constructed, Riyadh’s yearly CO2 emissions will be reduced by 6019 t.
Emission Reduction For Nuclear Power Plant
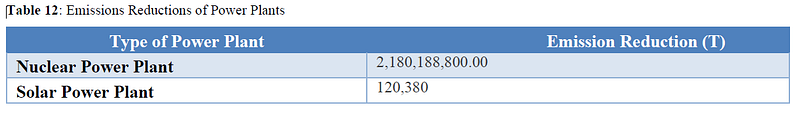
According to the information in Renewable Energy Sources of Riyadh, if a nuclear power plant is built to provide energy to the city of Riyah, it can help reduce carbon emissions. The carbon reduction of nuclear energy is also calculated with Equation 12, For the same renewable energy sources, it is expected that the project emission will be zero (Nuclear Power and the Environment — U.S. Energy Information Administration (EIA), n.d.). As a result of the calculation, there will be an annual reduction of 2,180,188,800 t of CO2 emissions.
Additional Solutions For Minimizing CO2 Emissions
The Saudi Green Initiative
Global CO2 emissions has almost doubled in the past 30 years, as a result to such increase each country started setting goals and putting green initiatives to battle this rapid increase in CO2 emissions to reduce the risks of CO2 which leads to global warming and to improve the quality of future generations lives. Kingdom of Saudi Arabia plans to reduce its CO2 emissions throughout a multi-layered approach which includes:
Additional Solutions for Minimizing CO2 Emissions in Riyadh
•Decreasing the dependency on fossil fuels and increasing the production of sustainable energy
- Developing the public transportation by increasing the capacity and quality of it.
Saudis’ government already started implementing acts to fight global warming and reducecarbon emissions,Riyadh the capital city of the kingdom has started planting many plants in the city and the plans are to plant up to 7.5 million trees in the capital to reduce carbon emission and toincrease the community’s awareness of the importance of preserving and protecting trees and greenspaces. At the same time, the crown prince of the kingdom has made a vow that Saudi will plant 450M trees by 2030 reducing more than 270m tons of carbon emissions per year.
Circular Carbon Economy
Although carbon dioxide is an essential element for life and maintaining global heat, its increase since the establishment of industry has become a problem for the atmosphere, which ledto the problem of global warming.The circular carbon economy it is a basic concept for the management of harmful excess carbon dioxide. This process is based on the fundamental value of not considering raw materials as waste after being used, on the contrary, it works to use these materials repeatedly. This process is based on four basics: reduction, reuse, recycling and removal. In Riyadh and Aramco, this technology has been adopted to reduce carbon dioxide emissions. (Circular Carbon Economy, 2022)
Result And Discussions
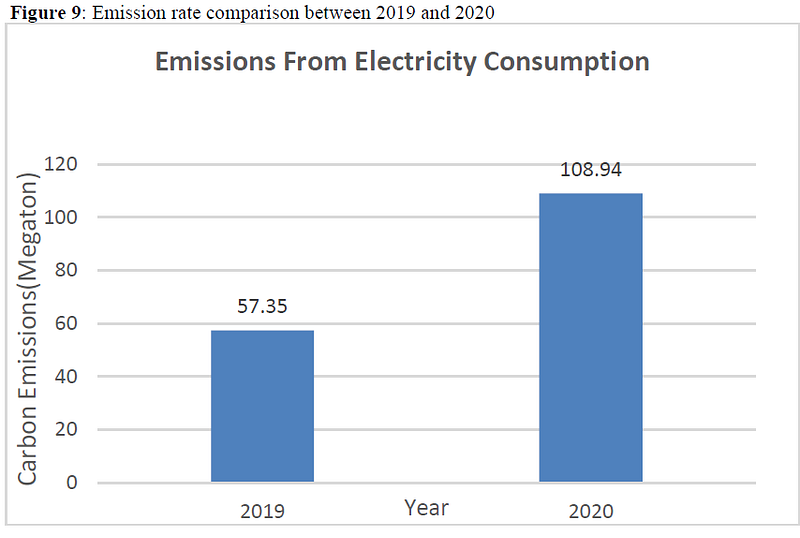
The utilization of carbon emissions determined using Riyadh’s energy consumption statistics for 2019 is 57,349,991.43 t CO2 (regional specific electricity factor for 2019: 0.7176). (kgCO2e per kWh). The graph below shows the amount of carbon emissions resulting from electricity consumption in the city of Riyadh for the years 2019 and 2020. When the carbon emission amount between 2019 and 2020 is compared with the carob amount in 2019, an increase of 52% is observed. The worldwide announcement of a pandemic with the effect of corona illness in the start of 2020 is the primary cause of this increase. There has been an increase in electricity consumption due to quarantine in people’s homes when they are no longer sick, as well as an increase in energy consumption throughout the country. In addition, electricity consumption in 2020 should be considered as the most important information. As seen in Figure 2, while the electricity need at the beginning of 2020 was 34.6 MW due to the pandemic, it was recorded that the electricity need increased to 40.9 MW at theend of April.(Alotaibi, S., n.d.)
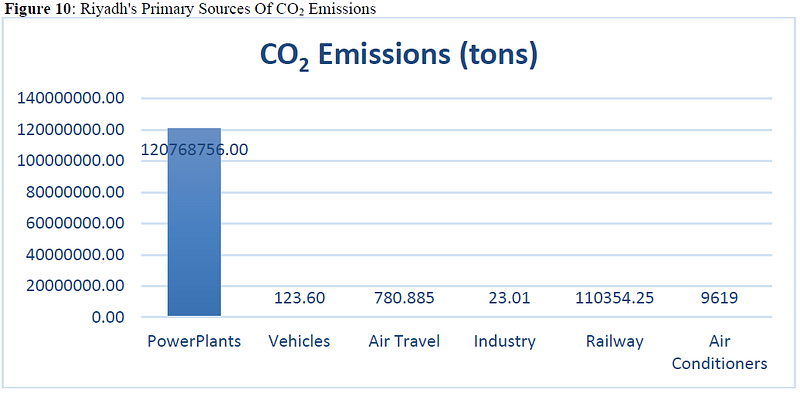
In the figure below, main sources of carbon emissions and the amount of emissions in Riyadhare given in tons (Figure 10). As Saudi Arabia generally produces energy based on fossil fuels,power plants can be shown as the main cause of carbon emissions in the city. To fulfil rising electricity demand and minimize carbon emissions, high-capacity solar power facilities or nuclear power plants must be developed in Riyadh. Emission reduction was estimated at 120380 tons in 20 years if a solar plant was built in the city, or 2,180,188,800 tons of carbon reduction over 20 years if a nuclear power plant was built.
Conclusion
Power plants in Riyadh significantly contribute to the city’s high carbon total emissions. While fossil fuels will continue to be used in energy production, utilization of renewable energy sources is highly increasing and spreading to reduce carbon emissions in Saudi Arabia. To accommodate rising electricity demand while reducing carbon emissions, high-capacity solarpower facilities or nuclear power plants must be built in Riyadh. In 20 years, a solar power plant in the city would cut emissions by 120380tons, whereas a nuclear power plant would reduce emissions by 2,180,188, 800 tCO2 emissions per capita in Saudi Arabia are 15.94 tons per person (based on a population of 32,443,447 in 2016) , a -0.22 decrease of 16.15 CO2 tons per person registered in 2015; this represents a -1.3 percent change in CO2 emissions per capita.The average worldwide carbon footprint per person must be less than 2 tons per person by 2050.
References
Callahan, W., James Fava, S. A., Wickwire, S., Sottong, J., Stanway, J., & Ballentine, M. (n.d.). CorporateValue Chain (Scope 3) Accounting and Reporting Standard Supplement to the GHG Protocol Corporate Accounting and Reporting Standard GHG Protocol Team
Electricity Consumption by Sectors. (2022, October 13).https://datasource.kapsarc.org/explore/dataset/electricity-consumption-by-sectors/table/?disjunctive.region
Breisinger, M., & Bank, D. (2012). Greenhouse Gas Assessment Emissions Methodology.http://www.iadb.org
CARBON FOOTPRINT COUNTRY SPECIFIC ELECTRICITY GRID GREENHOUSE GAS EMISSION FACTORS. (n.d.). www.carbonfootprint.com
Saudi Arabia Powerplants Output, CO2 and Intensity. (2017, December 27).https://datasource.kapsarc.org/explore/dataset/saudi-arabia-powerplants-output-co2-andintensity/information/?disjunctive.power_plant_name
Wikipedia contributors. (2022, November 14). Dammam–Riyadh line. Wikipedia.https://en.wikipedia.org/wiki/Dammam%E2%80%93Riyadh_line
Distances Among Railway Stations. (2022, July 29). https://datasource.kapsarc.org/explore/dataset/distancesamong-railway-stations-in-kilometres-2008-ad/information/?disjunctive.route
Railways’ Passengers, Freight and Revenues. (2022, October 11).https://datasource.kapsarc.org/explore/dataset/railways-passengers-freight-and-revenues-1999-2008-ad/information
Calculation Tools | Greenhouse Gas Protocol. (n.d.). Greenhouse Gas Protocol.https://ghgprotocol.org/calculation-tools
Appendix d Calculation formula summary tables Technical Guidance for Calculating Scope 3 Emissions[162] Appendix D: Calculation formula summary tables Appendix d Calculation formula summary tables Method Calculation Formula Activity Data Needed Emission Factor Needed. (n.d.)
Chapter 14 | Transportation. (2019, April 1). General Authority for Statistics.https://www.stats.gov.sa/en/1020
YALILI KILIÇ, M., DÖNMEZ, T., & ADALI, S. (2021). Karayolu ulaşımında yakıt tüketimine bağlı karbon ayak izi değişimi: Çanakkale örneği. Gümüşhane Üniversitesi Fen Bilimleri Enstitüsü Dergisi.https://doi.org/10.17714/gumusfenbil.848016
how-many-watts-does-an-air-conditioner-use. (n.d.). Bardi. https://bardi.com/how-many-watts-does-an-air conditioner-use/
How Much Power Does An Air Conditioner Use? (2022, September 20). American Home Water & Air.Retrieved December 28, 2022, from https://americanhomewater.com/how-much-power-does-an-airconditioner-use/
UNdata. (n.d.). http://data.un.org/Data.aspx?d=EDATA
Air Traffic in the Kingdom’s Airports According to the Operator. (2022, October 11).https://datasource.kapsarc.org/explore/dataset/air-traffic-in-the-kingdoms-airports-according-to-theoperator/table/
India Speciic Air Transport Emission Factors for Passenger Travel and Material Transport For Stakeholder Consultation. (n.d.)
Saudi Aramco Joins World Bank’s Initiative: ‘Zero Routine Flaring by 2030.’ (2019, November 6). SaudiAramco. https://www.aramco.com/en/news-media/news/2019/zero-routine-flaring-by-2030-initiative
Boisgibault, L., & Kabbani, A. F. (2020). Energy Transition in Metropolises, Rural Areas, and Deserts (1sted.). Wiley-ISTE.
Deeb, A., Rouvali, J., & Ijäs, J. (2019). LARGE-SCALE PV SOLAR POWER PLANT & ENERGY STORAGE SYSTEM Middle East & North Africa Title of Project Large-Scale PV Solar Power Plant & Energy Storage System
Guidelines for Estimating Greenhouse Gas Emissions of ADB Projects: (2017).https://doi.org/10.22617/TIM178659-2
Nuclear power and the environment — U.S. Energy Information Administration (EIA). (n.d.). U.S. Energy Information Administration (EIA). https://www.eia.gov/energyexplained/nuclear/nuclear-power-andtheenvironment.php#:%7E:text=Nuclear%20power%20reactors%20do%20not,or%20carbon%20dioxide%20while%20operating.
Circular carbon economy. (2022, December 6). Saudi Aramco.https://www.aramco.com/en/sustainability/climate-change/managing-our-footprint/circular-carbon-economy
Alotaibi, S. (n.d.). Special Report The Impact of the COVID-19 Pandemic on the Energy Sector in theKingdom of Saudi Arabia: The Future of Renewable Energy after the Crisis.