
RESHAPING DATAFRAMES WITH PANDAS
Meet the hardest functions of Pandas, Part II
Master the when and how of crosstab()

Introduction
I remember myself enjoying a course named “Intermediate Data Visualization with Seaborn” on DataCamp. It was teaching pretty awesome plots and methods for DV. When it came to heatmaps, the instructor, out of nowhere introduced a completely new pandas function crosstab(). Then, quickly said: "crosstab() is a useful function that calculates cross-tabulation tables..."
I was lost right there. Obviously, my first instinct was to check out the documentation for the function. I was just starting to feel that I could handle any documentation after Matplotlib’s, and… I was wrong. Even the examples were given on numpy arrays while I was supposed to create heatmaps using the damn function🤦♂️.
After I had my practice on it, I knew that this was something that others would struggle too. So, here I am writing a whole article on it.
In the last part of this article, I talked about why some courses don’t teach you advanced functions like crosstab(). It is simply hard to create the context such functions will be useful in, while keeping the level of examples to beginner. Besides, most courses use small or toy datasets. The benefit of such functions is more pronounced in more complex data science environments and often used by more experienced pandas users.
In this post, I teach you how to use crosstab() and the cases where you choose it over other similar functions. Enjoy!
Get the best and latest ML and AI papers chosen and summarized by a powerful AI — Alpha Signal:
Clickable Table of Contents (web-only)
∘ Introduction ∘ Setup ∘ Pandas crosstab(), the basics ∘ Pandas crosstab() comparison with pivot_table() and groupby() ∘ Pandas crosstab(), customizing even further ∘ Pandas crosstab(), multiple groupings
You can download the notebook of this article on this GitHub repo.
Setup
For the sample data, I will be using the diamonds dataset that is built-in to Seaborn. It is sufficiently large enough and has variables that are good to summarize with crosstab():
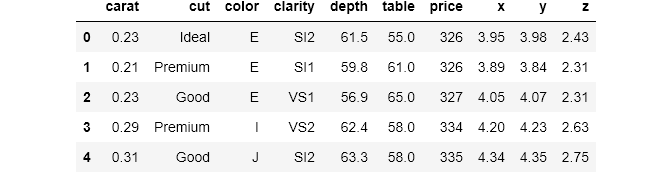
I hyperlinked each function’s documentation at their first appearance from here on.
Pandas crosstab(), the basics
Like many functions that compute grouped summary statistics, crosstab() works with categorical data. It can be used to group two or more variables and perform calculations for a given value for each group. Of course, such operations are possible using groupby() or pivot_table() but as we are going to see later, crosstab() introduces a number of benefits to your daily workflow.
crosstab() function takes two or more lists, pandas series or dataframe columns and returns a frequency of each combination by default. I always like to start with an example so that you can better understand the definition and then I will move on to explain the syntax.
crosstab() always returns a dataframe and below is an example. The dataframe is a cross-tabulation of two variables from diamonds: cut and color. Cross tabulation just means taking one variable, displaying its groups as indexes, and taking the other, displaying its groups as columns.
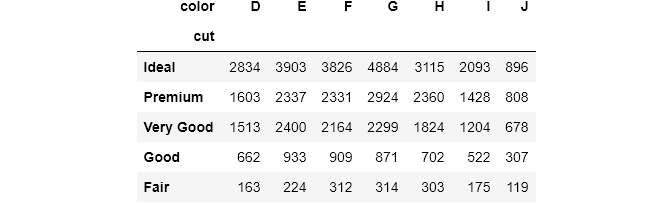
The syntax is fairly simple. index is used to group a variable and display them as indexes (rows) and the same for columns. If no aggregating function is given, each cell will calculate the number of observations in each combination. For example, the top-left cell tells us that there are 2834 ideally-cut diamonds with color code D.
Next, for each combination, we want to see their mean price. crosstab() provides values parameter to introduce a third numerical variable to aggregate on:
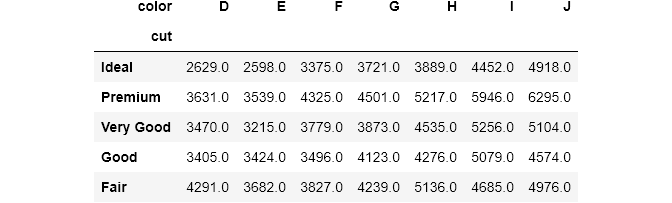
Now, each cell contains the mean price for each combination of cut and color. To tell that we want to compute the mean price, we pass the price column to values. Note that you always have to use values and aggfunc together. Otherwise, you will get an error. I also used round() to round up the answers.
Even though it is a little advanced, you will exploit the benefits of crosstab() tables fully, when you pass them into seaborn's heatmaps. Let's see the above table in a heatmap:
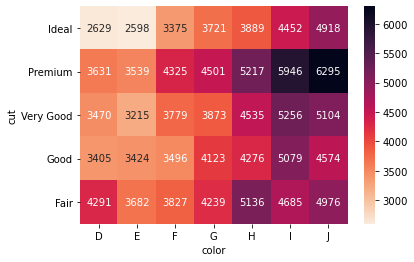
seaborn can automatically turn the crosstab() tables into heatmaps. I set annotations to True and displayed the heatmap with a color bar. seaborn also adds styling to column and index names (fmt = 'g' displays the numbers as integers instead of scientific notation).
Heatmaps are much easier to interpret. You don’t want your end users’ eyes bleed by looking at a table full of numbers. So, I will be putting each crosstab() result into a heatmap whenever I need to. To avoid repetition, I created a helpful function:
Pandas crosstab() comparison with pivot_table() and groupby()
Before we move on to more fun stuff, I think I need to clarify the differences between the three functions that compute grouped summary stats.
I covered the differences of pivot_table() and groupby() in the first part of the article. For crosstab(), the difference between the three is the syntax and the shape of results. Let's compute the last crosstab() table using all three:
I think you already know your favorite. groubpy() returns a series while the other two return identical dataframes as a result. However, it is possible to turn the groupby series into the same dataframe like this:
If you don’t understand the syntaxes of
pivot_table()andunstack(), I highly suggest you read the first part of the article.
When it comes to speed, crosstab() is faster than pivot_table() but both are much slower than groupby():
As you see, even when chained with unstack(), groupby() is 3 times faster than the other two. This tells that if you just want to group and compute summary stats, you should use the same ol' groupby(). The speed difference was even larger when I chained other methods like simple round().
The rest of the comparison will mainly be about pivot_table() and crosstab(). As you saw, the shape of the results of the two functions is the same. The first difference between the two is that crosstab() can work with any data type.
It can accept any array-like objects such as lists, numpy arrays, data frame columns (which are pandas series). In contrast, pivot_table() only works on dataframes. In a helpful StackOverflow thread, I found out that if you use crosstab() on a dataframe it calls pivot_table() under the hood.
Next are the parameters. There are parameters that exist only in one and vice versa. The first one which is the most popular is crosstab()'s normalize. normalize accepts these options (from the documentation):
- If passed
allorTrue, will normalize over all values. - If passed
indexwill normalize over each row. - If passed
columnswill normalize over each column.
Let’s see a simple example:
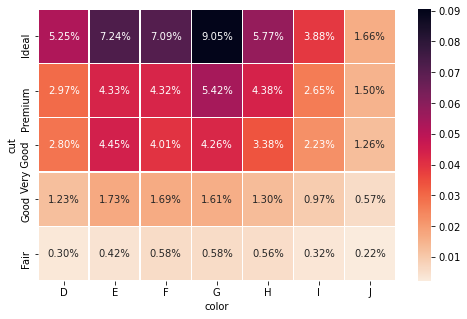
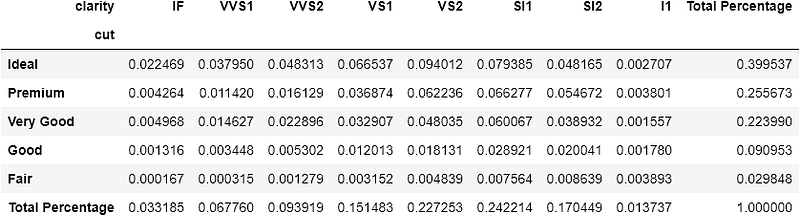
If passed all, for each cell, pandas calculates the percentage of the overall amount:
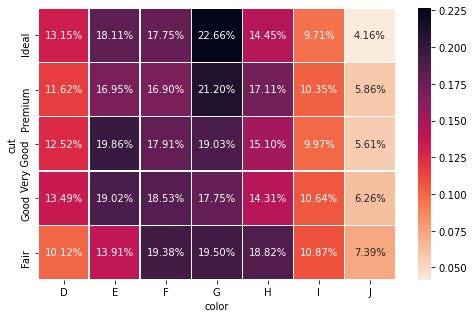
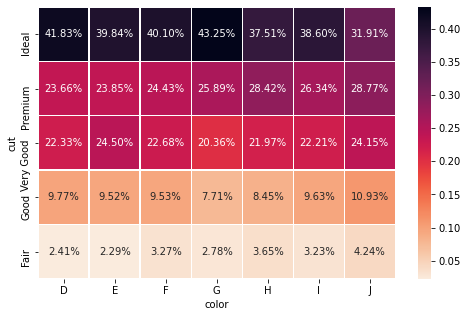
If passed, index or columns, the same operation is done column-wise or row-wise:
In crosstab() you can also change the index and column names directly within the function using rownames and colnames. You don't have to do it manually afterward. These two arguments are very useful when we group by multiple variables at a time, as you will see later.
The parameter fill_value only exists in pivot_table(). Sometimes, when you group by many variables, it is inevitable that there will NaNs. In pivot_table(), you can change them to custom value using fill_value:
But, you can achieve the same thing by chaining fillna() on the dataframe, if you use crosstab():
Pandas crosstab(), customizing even further
Two other useful parameters for crosstab() are margins and margins_name (both exist in pivot_table() too). When set to True, margins computes subtotals for each row and column. Let's see an example:
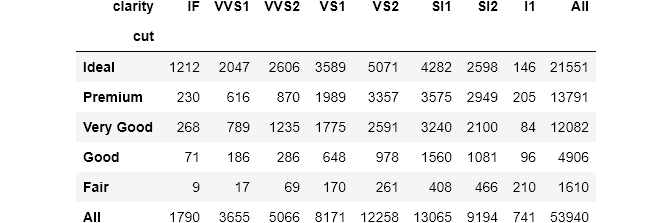
pandas automatically adds a final row and a final column with a default name All. margins_name controls that behavior:
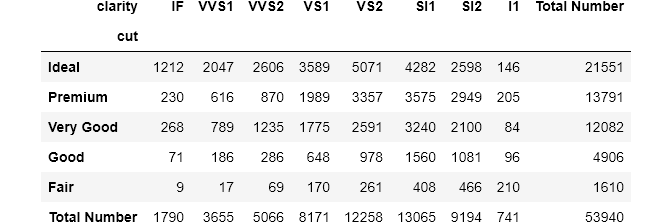
The bottom right cell will always contain the overall number of observations or 1 if, for example, normalize is set to True:
Note that heatmaps are useless if you set
marginstoTrue.
Pandas crosstab(), multiple groupings
For index and columns arguments, you can pass multiple variables. The result will be a dataframe with MultiLevel indexes. Let's plug in all the categorical variables this time:
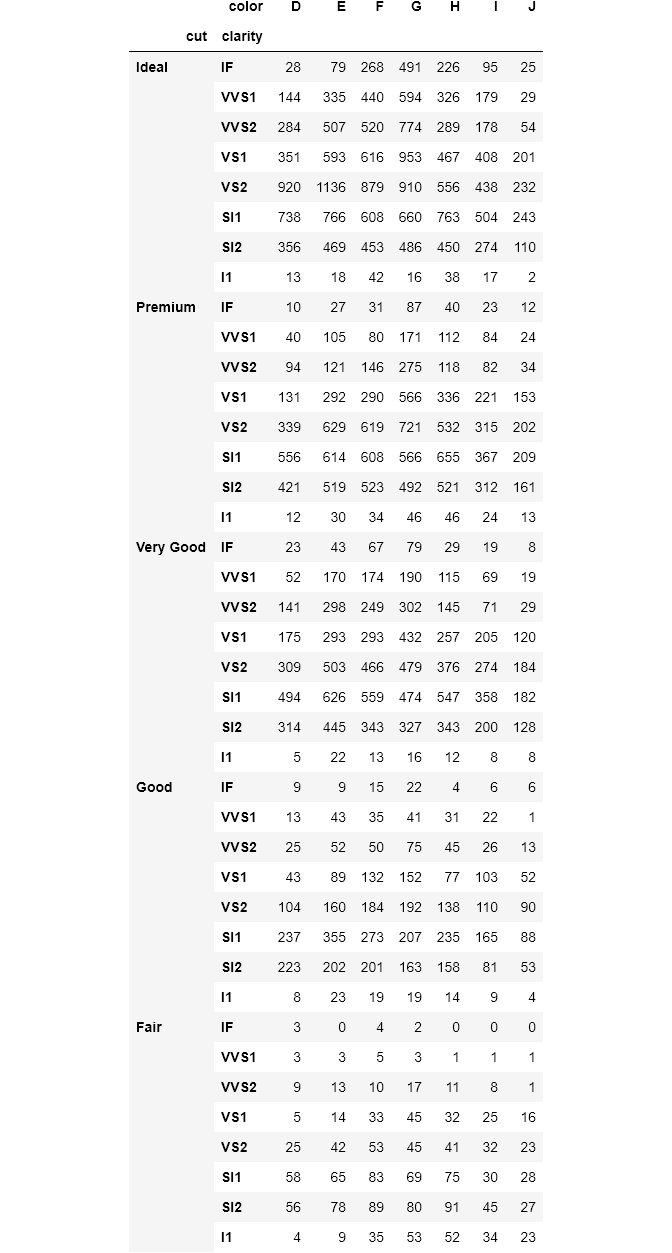
For the index, I passed the color and cut. If I passed them to columns, the result would be a dataframe with 40 columns. If you pay attention, the MultiLevel indexes are named as cut and clarity as expected. For such situations where there are MultiLevel index or column names, crosstab() has handy parameters to change their name:
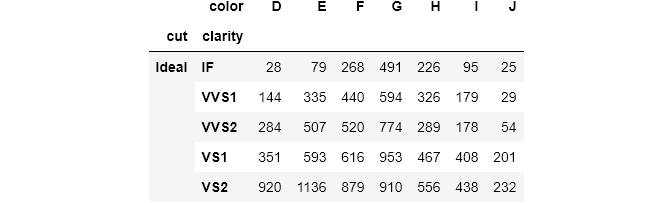
You pass a list of corresponding names to change the index names to rownames. The process is the same for colnames which controls the column names.
One thing that surprised me was that if you pass multiple functions to aggfunc, pandas throws an error. Again, the dudes on StackOverflow think that it is a bug and it has not been resolved for more than 6 years already. If you have any ideas, please leave them out in the comments so we can all learn🙌.
As a final note, in both pivot_table() and crosstab(), there is a dropna parameter that drops columns or rows with all NaNs if set to True.
If you liked the article, please share it and leave feedback. As a writer, your support means the world to me!
Read more articles related to the topic:


