
Maximizing Data Potential: A Step-by-Step Guide to Implementing a Lakehouse in Microsoft Fabric
This is my first in-depth blog, where I’m thrilled to showcase the remarkable capabilities of a lakehouse in Microsoft Fabric. This journey will illuminate the powerful features and potential of this platform, offering a detailed exploration of its innovative approach to data management and analysis. Let’s dive in! 🚀📊
In our data-driven world, the evolution from traditional data warehouses to the dynamic concept of a data lakehouse isn’t just a technical shift; it’s a strategic revolution. Think of a data warehouse as a meticulously organized library, where data is stored in neatly arranged, relational tables and accessed through SQL. This system, while efficient, struggled to keep pace with the explosive growth of ‘big data’ a deluge of diverse, rapid, and voluminous information.
That’s where the idea of a data lake comes into play. Picture a vast, unstructured storage space similar to a warehouse brimming with books of all genres and topics, placed without specific order. In a data lake, data is stored in its native format, offering flexibility but posing a challenge: how do we efficiently locate and utilize specific data from this enormous reservoir?
The answer lies in the ingenious concept of a data lakehouse, a synthesis of the structured and unstructured worlds. Imagine adding a sophisticated, digital catalog to our metaphorical warehouse, enabling us to swiftly locate any book. A data lakehouse maintains data in file form within a data lake, while superimposing a structured, relational schema. This allows us to query data using familiar SQL, merging the flexibility of a data lake with the organization of a data warehouse.
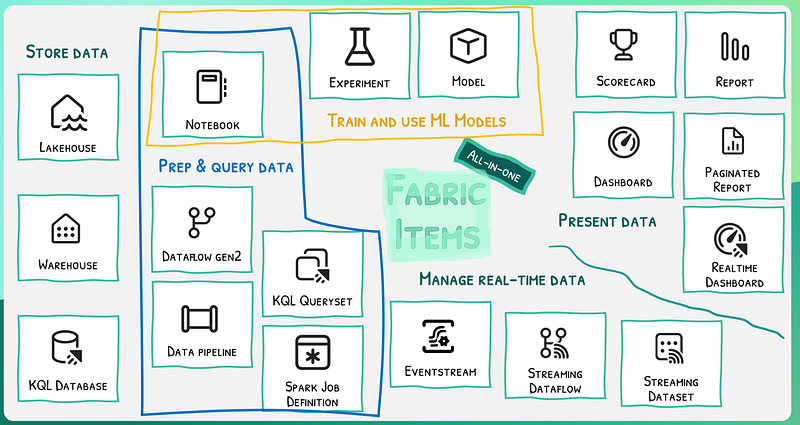
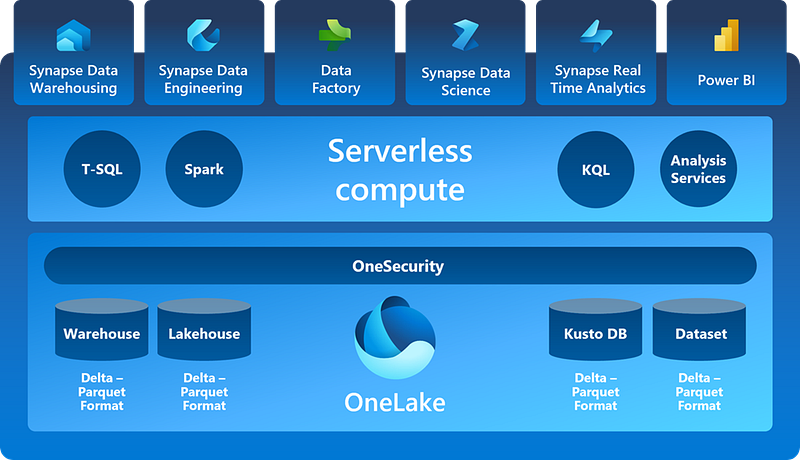
In this arena, Microsoft Fabric emerges as a frontrunner. It’s not just about offering a place to store data; it’s about creating an ecosystem where data is not only stored but also seamlessly integrated and efficiently processed. With Microsoft Fabric, we leverage OneLake a scalable file storage solution built on the robust Azure Data Lake Store Gen2 — and a metastore for relational objects, using the innovative Delta Lake table format. Delta Lake stands out by enabling structured schematization of tables within the lakehouse, ensuring that data isn’t merely stored but is also readily queryable using SQL.
But why does this matter to businesses and data professionals? It’s simple. This technological advancement enables quicker, more insightful data analysis from diverse sources. It’s about agility, adaptability, and the power to make informed, data-driven decisions rapidly. With Microsoft Fabric’s lakehouse model, data is not just a resource; it becomes a catalyst for innovation and strategic insights, driving businesses towards unprecedented efficiency and growth.
Setting the Stage for Your Data Adventure in Microsoft Fabric 🚀
Welcome to the beginning of your journey with Microsoft Fabric! 🌐 Think of it as stepping into a new world where data comes alive. Your first step? Creating your very own workspace.
- Head to the Start: On the Microsoft Fabric home page, where all journeys begin, you’re just a few clicks away from your data expedition. 🖱️
- Find Your Path: Look for ‘Synapse Data Engineering’ — it’s your gateway to the wonders of data workspaces. Like choosing the right tool for a treasure hunt, this is where your adventure really starts. 🔍
- Discover ‘Workspaces’: On the left-hand menu, spot the 🗇 icon. This is where the magic happens. Click it, and you’re on your way to creating something amazing.
- Create and Name Your Workspace: Here’s where you plant the seed for your future data endeavors. Pick a name that captures the essence of your project. 📛
- Choose Your Magic Wand: Select your licensing mode (Trial, Premium, or Fabric). Each has its own set of powers, so choose wisely! 🧙♂️
- Begin with a Blank Canvas: Once you’ve set up your workspace, it’ll be a clean slate, ready and waiting for your data stories to unfold. 🎨
Constructing Your Data Kingdom: Building a Lakehouse 🏰
With your workspace set up, you’re ready for the next exciting chapter — creating your very own data lakehouse. Think of it as constructing a castle where your data will live and thrive.
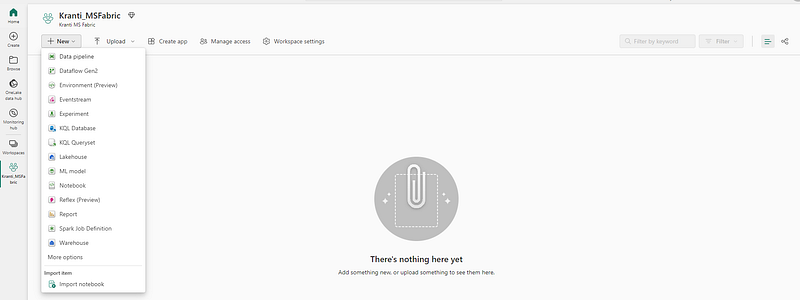
- Begin at the Heart of Synapse: Head back to the Synapse Data Engineering home page. It’s your command center, where big things start with just a click. 🌟
- Name Your Data Realm: Create a new Lakehouse and give it a name. This name is like a flag you plant on your data territory, claiming it as your own. 🚩
- Watch It Come to Life: After a brief wait (just enough time to grab a cup of coffee ☕), your lakehouse will be ready. It’s like watching the walls of your castle rise from the ground.
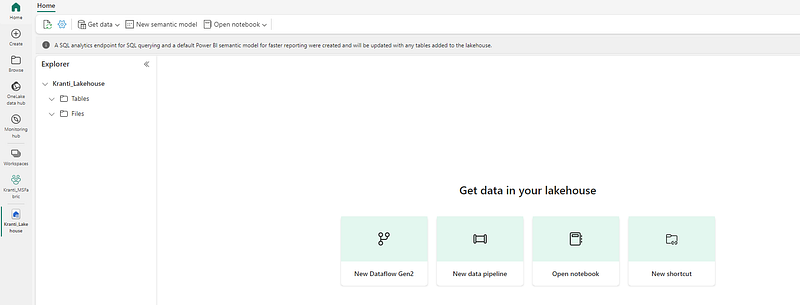
- Explore Your New Domain: Take a moment to view your new lakehouse. In the Lakehouse explorer pane, you’ll find two key areas:
- The Tables Folder 📊: This is where your data tables, structured in the Delta Lake file format (a favorite in Apache Spark circles), will live. It’s like the grand hall of your castle, where the important data feasts will happen.
- The Files Folder 📁: Here lie your data files in the OneLake storage, not yet part of your structured tables. Think of it as the castle’s storeroom. You can also set up shortcuts here, like secret passages to data stored in far-off lands.
A Blank Slate: Right now, your lakehouse is like an empty castle, waiting to be filled with tables and files. It’s a canvas ready for your data masterpieces. 🎨
Embarking on a Data Expedition: Uploading Your Treasure 🗺️
Now that you’ve established the grandeur of your lakehouse, it’s time to start filling its halls with treasures. Let’s embark on an expedition to bring in your first gem — a data file.
- Choose Your Path of Ingestion: In the world of Fabric, there are numerous trails to bring data into your lakehouse. You have pipelines that act like trained falcons, fetching data from distant lands, and visual tools akin to maps drawn in Power Query. 🌍
- Opt for Simplicity: But sometimes, the simplest tools are the best. To start, think of uploading files as sending a carrier pigeon with a vital message. This method is perfect for small yet precious data loads, like a handful of glittering jewels. 🕊️
- Navigate to Your Lakehouse: Return to the realm of your lakehouse, where your data awaits its new home.
- Create a New Home for Your Data: In the Lakehouse explorer pane, find the Files folder. Here, create a new subfolder named ‘data’ — think of it as setting up a special vault in your castle for your first treasure. 🏰
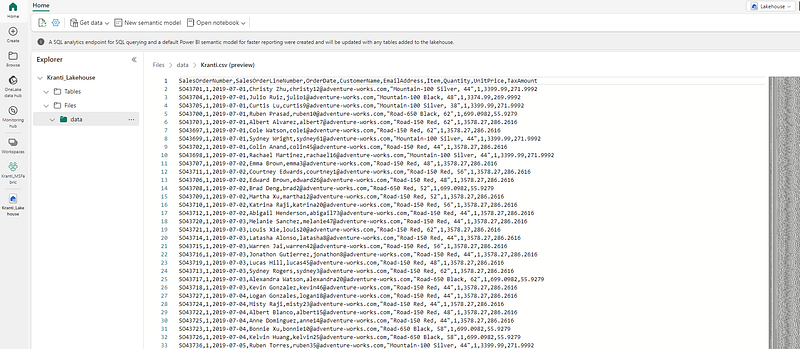
- Begin the Upload: Now, it’s time to bring in your prize — the ‘Kranti.csv’ file. This file is like a map to hidden treasures, full of valuable insights. Select ‘Upload’ and ‘Upload file’ from the menu, and let your file embark on its journey to the lakehouse. 📤
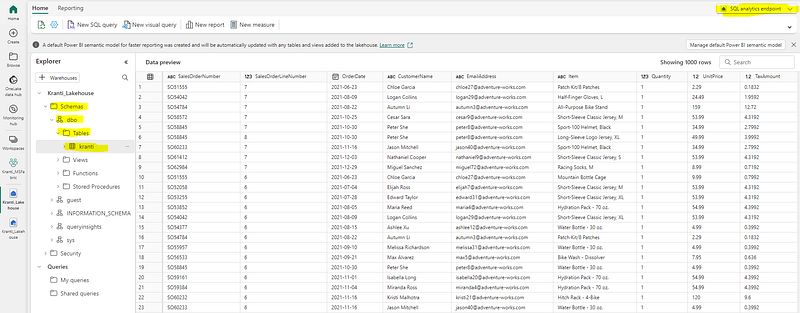
- Witness the Arrival: Once the upload is complete, visit the Files/data folder. Here, you should see your ‘Kranti.csv’ file, now a part of your data kingdom. It’s like watching a newly discovered artifact being placed in your castle’s treasure room. 🏆
- Preview Your Treasure: Click on the ‘Kranti.csv’ file to sneak a peek at its contents. It’s like unrolling an ancient scroll, revealing secrets waiting to be deciphered. 📜
Navigating the Crossroads: The Art of Creating Shortcuts 🗺️
In the grand tapestry of your data lakehouse, sometimes the data you seek lies beyond its walls, in distant digital realms. Here, we’ll explore the art of creating shortcuts, a clever way to bring faraway data closer to home without the need for a long journey.
- The Power of Shortcuts: Think of shortcuts as mystical portals. They allow you to access data stored in other locations, bringing it into your lakehouse’s sphere of influence. This magic lies in their ability to bridge distances without the need to physically move the data, thereby keeping your castle’s data landscape unified and consistent. 🌌
- Setting the Stage: Begin this enchantment in the Files folder of your lakehouse. Here lies the potential to connect worlds.
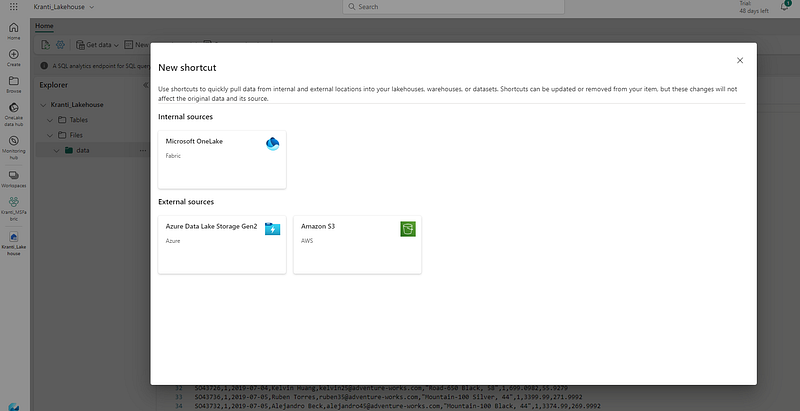
- Summoning the Portal: In the menu, select ‘New shortcut’. It’s like drawing a circle of runes on the ground, preparing to open a gateway to another realm. 🌀
- Peek into Other Worlds: As you initiate this process, you’ll be presented with a variety of data source types, each a doorway to different external lands of data. It’s a moment to marvel at the possibilities, to see where these portals could take you. 🚪
- Pause and Reflect: However, for now, you choose to close the New shortcut dialog box without creating a shortcut. It’s like stepping back from the circle of runes, deciding to explore these paths another time. Sometimes, understanding your options is a vital step in itself. 🤔
Transforming Data into Wisdom: Loading File Data into a Table 🌟
Your journey in the lakehouse now leads you to a crucial step: transforming the Kranti data file into a treasure trove of queryable knowledge.
- Begin Where Your Data Lies: Your adventure starts at the Home page. Navigate to the Files/Data folder, where the ‘Kranti.csv’ file, your map of raw data, resides. 🗂️
- Invoke the Transformation: Here, the ‘Kranti.csv’ file is like a raw gem. To reveal its true value, select ‘Load to Tables’ from the file’s menu. This action is akin to cutting and polishing a rough diamond, preparing it to shine brilliantly. 💎
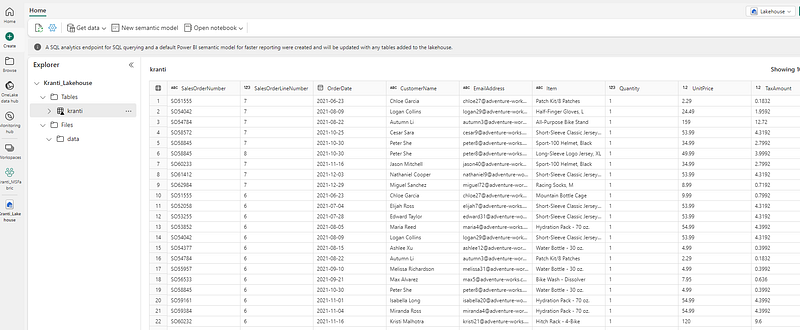
- Crafting the Data Jewel: In the ‘Load to table’ dialog box, you bestow a name upon your new creation — ‘Kranti’. Confirming the load operation, you initiate the alchemy that turns raw data into a structured table, a source of insight and clarity. 🔮
- Witness the Metamorphosis: As you wait, the data transforms and takes its place in the Lakehouse explorer pane. The ‘Kranti’ table, now a part of your kingdom, is ready to be explored. It’s like unveiling a masterpiece that was hidden within a block of marble.
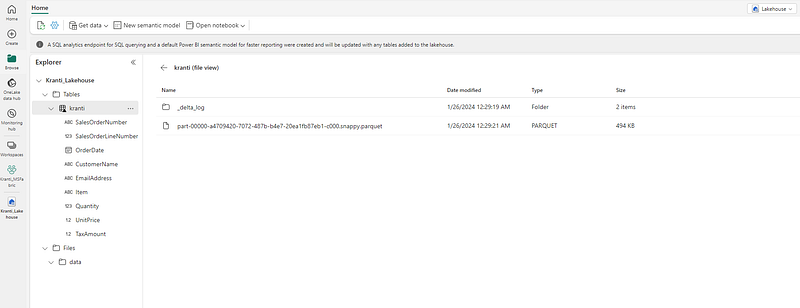
- Peek Behind the Curtain: Curious about the magic? Select ‘View files’ from the ‘Kranti’ table menu. You’ll see the files in Parquet format, the backbone of your table, and a special subfolder named ‘_delta_log’. This is where the tales of your table’s journey — its transactions and transformations — are chronicled. 📚
Unveiling Secrets with SQL: The Power of Queries 🧙♂️
Your data adventure in the lakehouse now leads you to a realm of discovery and insight — querying tables using SQL. This is where your data starts conversing with you, revealing its hidden stories.
- Shift Your Perspective: At the Lakehouse page, a subtle but powerful shift awaits. Move from the Lakehouse view to the SQL endpoint at the top-right corner. It’s like switching from a bird’s-eye view of a forest to walking among its trees. 🌳➡️🔍
- Await the Opening of a New World: Give it a moment. Like the slow opening of a treasure chest, the SQL query endpoint for your lakehouse will unveil itself. This visual interface is your gateway to converse with your data, to ask questions and seek answers. 💬
- Compose Your Data Inquiry: Click on the ‘New SQL query’ button. Here, you stand before a blank canvas, ready to craft your query. Think of it as writing a letter to your data, asking it to reveal its secrets. 📝
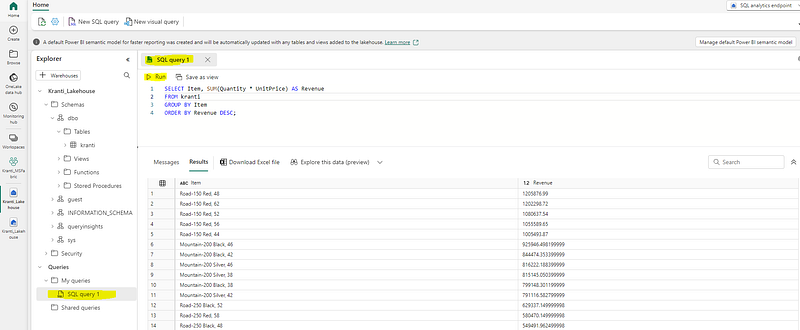
- Whisper Your Question: In the query editor, write your SQL query. It’s like casting a spell, where each line of code is an incantation, drawing out the knowledge hidden within your data. 🪄
- Invoke the Answer: Hit the ▷ Run button. This is the moment of truth. Like a wizard summoning answers from the ether, you await the response to your query.
- Behold the Revelation: As the results appear, they unveil the total revenue for each product. It’s a revelation, the uncovering of a secret that was always there, waiting beneath the numbers and names in your ‘Kranti’ table. 📊
Crafting a Masterpiece: The Art of Visual Queries 🎨
As we continue our journey through the lakehouse, we now embrace the fusion of art and data. Here, Power Query skills meet the elegance of visual queries, perfect for those who paint stories with data.
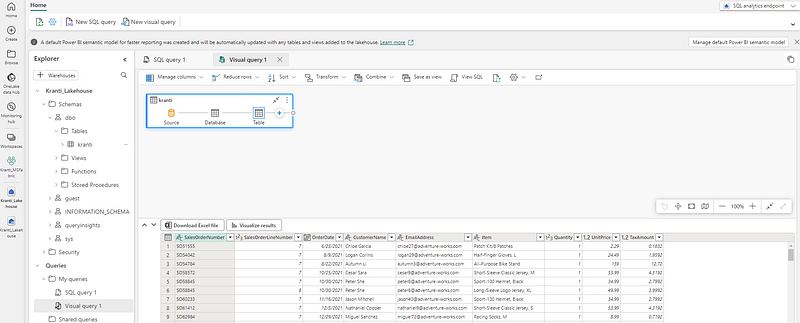
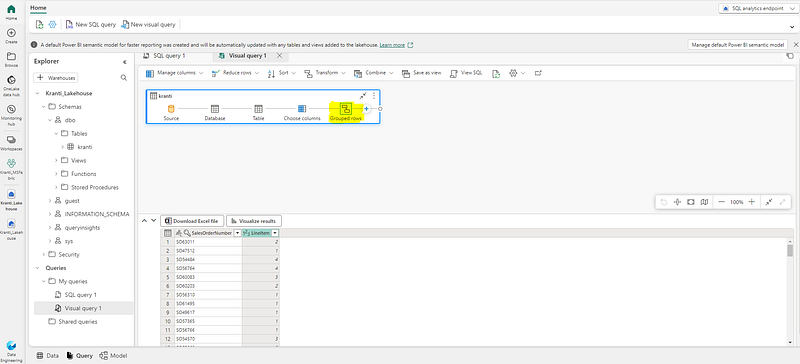
- Select Your Canvas: Look for the ‘New visual query’ button on the toolbar. This is your invitation to start a new kind of data exploration, one where insights are not just found but visually crafted. 🖌️
- Bring in Your Subject: As the visual query editor pane springs to life, it’s time to introduce the star of your show — the ‘Kranti’ table. Drag it into the pane. It’s like placing the first stroke on your canvas, the beginning of something that promises to be extraordinary. 🌟
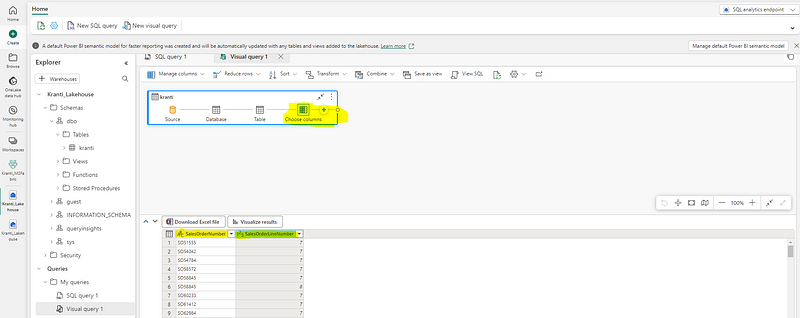
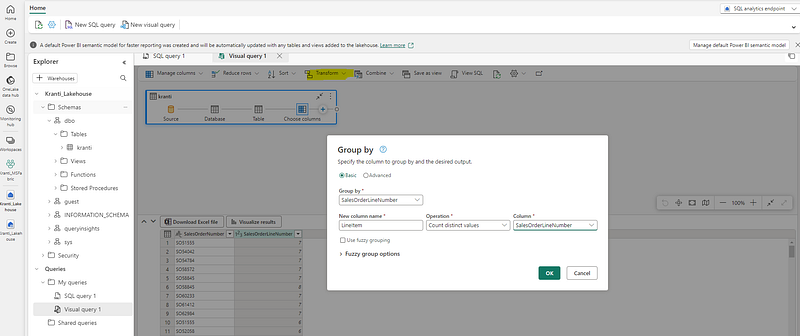
- Sculpt Your Data: Now, dive into the ‘Manage columns’ menu and select ‘Choose columns’. This is where you sculpt your data, chiseling away the excess to reveal the essential. Think of it as selecting the colors for your palette — only what you need for your masterpiece. 🎨
- Focus on the Details: From the myriad of columns, choose only ‘SalesOrderNumber’ and ‘SalesOrderLineNumber’. This focus is like zooming in on the most captivating elements of your painting, ensuring every brushstroke adds to the narrative. 🔍
The Final Brushstroke: Crafting a Power BI Report 📊
As we reach the final stage of our data journey in the lakehouse, it’s time to bring everything together in a Power BI report. This is where data, analysis, and visualization converge to tell the complete story.
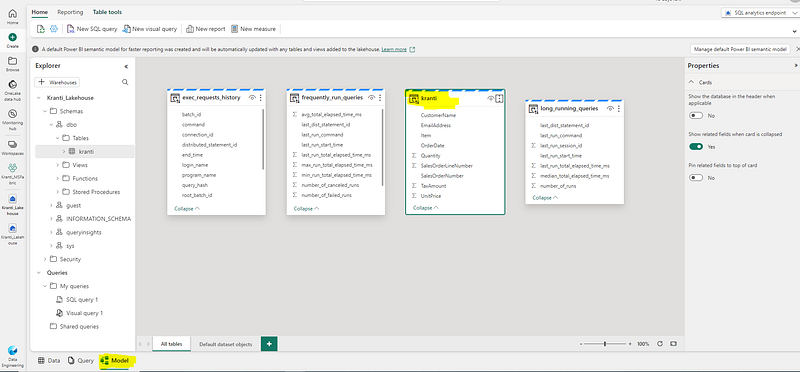
- Laying the Groundwork: Start at the SQL Endpoint page, and find your way to the Model tab at the bottom. Here, you’ll see the data model schema for your dataset, like a blueprint of your data’s architecture. 🏗️
- Embarking on the Report Creation: Now, head to the Reporting tab in the menu ribbon and select ‘New report’. As a new browser tab opens, you enter the realm of report design — your data’s stage. 🎭
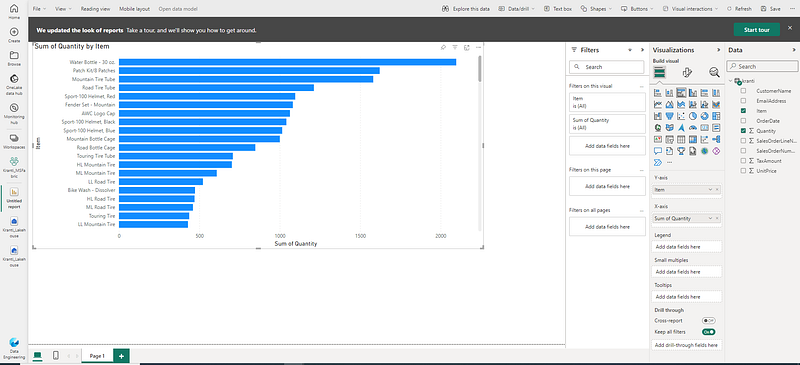
- Selecting the Stars of Your Show: In the Data pane, the ‘kranti’ table awaits your direction. Expand it and shine a spotlight on ‘Item’ and ‘Quantity’. These fields are your lead actors, ready to perform on the visualization stage. 🌟
- Visual Symphony: As you make your selections, a table visualization emerges, adding a tangible form to your data insights. It’s like the orchestra starting to play, each note resonating with meaning. 🎻
- Saving Your Masterpiece: Go to the File menu and select Save. Name your creation ‘Item Sales Report’ and save it in the workspace you crafted earlier. It’s like framing a painting, ready for the world to see. 🖼️
- Closing the Chapter: With your report now part of your workspace’s tapestry, close the report’s browser tab. Return to the SQL endpoint for a final glance at your lakehouse’s landscape.
- Reflecting on Your Creation: Back in the hub menu, take a moment to appreciate the elements of your journey — your lakehouse, the SQL endpoint, the default dataset, and, of course, the ‘Item Sales Report’. It’s a collection that tells a story of exploration, discovery, and creation. 📜
In our journey with Microsoft Fabric, we’ve unlocked the transformative power of data, from building lakehouses to crafting insightful reports. This tool isn’t just powerful; it’s a gateway to deeper understanding and innovation. Here’s to your continued exploration and success with Microsoft Fabric — a remarkable partner in your data storytelling adventure. Happy learning! 🚀🌟
In Microsoft Fabric, a lakehouse provides highly scalable file storage in a OneLake store (built on Azure Data Lake Store Gen2) with a metastore for relational objects such as tables and views based on the open source Delta Lake table format. Delta Lake enables you to define a schema of tables in your lakehouse that you can query using SQL.


