Maximize Your Trading Potential Using This Powerful Indicator
Presenting K’s Reversal Indicator III in TradingView

In previous articles, two powerful indicators have been discussed, K’s Reversal Indicator I and K’s Reversal Indicator II, with the former having a combination of indicators and conditions to deliver a contrarian signals, and the latter using moving averages to calculate strong reversal points. This article will form the third indicator in the K’s collection.
The Concept of Correlation & Autocorrelation
Correlation and autocorrelation are statistical concepts commonly used in the analysis of financial time series data.
Correlation is a measure of the degree to which two variables are related or move together. In the context of financial time series, correlation is often used to assess the relationship between the returns of two different assets, such as stocks, bonds, or other financial instruments. Correlation is typically measured on a scale from -1 to 1:
- A correlation coefficient of 1 indicates a perfect positive correlation, meaning that the two variables move in perfect harmony, increasing and decreasing together.
- A correlation coefficient of -1 indicates a perfect negative correlation, meaning that the two variables move in perfect opposition, when one increases, the other decreases.
- A correlation coefficient close to 0 suggests little to no linear relationship between the two variables, implying they are not strongly related.
For example, if you calculate the correlation between the daily returns of two stocks and get a value of 0.7, it means that there is a positive correlation between the returns of these stocks, indicating that when one stock goes up, the other is likely to go up as well, but the relationship is not perfect.
Autocorrelation (Serial Correlation): Autocorrelation, also known as serial correlation, is a specific type of correlation that measures the relationship between a variable and its own past values at different time lags. In the context of financial time series, autocorrelation examines whether there is a correlation between the current value of a financial variable (e.g., stock price or return) and its past values at various time intervals.
Autocorrelation is commonly used to identify patterns and dependencies in financial data. A positive autocorrelation at a certain time lag indicates that the variable tends to be correlated with itself after a specific number of time periods, suggesting the presence of a repeating pattern. A negative autocorrelation suggests that the variable tends to be inversely related to itself at certain lags.
For example, if you calculate the autocorrelation of a stock’s daily returns at a lag of 1 day and find it to be positive, it suggests that there is some degree of correlation between today’s return and yesterday’s return. This information can be useful for forecasting and modeling purposes in finance. Let’s see how to use this knowledge in creating the indicator.
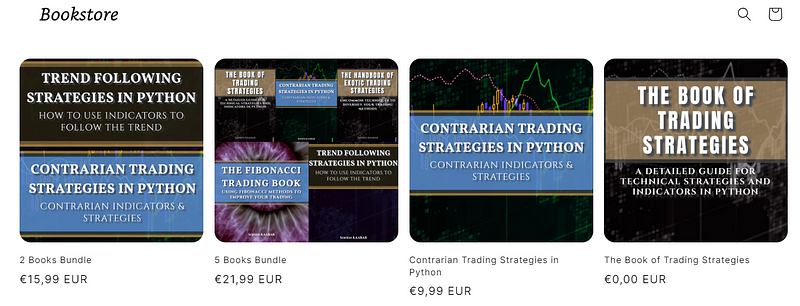
If you want to see more of my work, you can visit my website for the books catalogue by simply following the link attached the picture:
K’s Reversal Indicator III
In previous articles, two powerful indicators have been discussed, K’s Reversal Indicator I and K’s Reversal Indicator II, with the former having a combination of indicators and conditions to deliver a contrarian signals, and the latter using moving averages to calculate strong reversal points. This article will form the third indicator in the K’s collection. It is based on the concept of autocorrelation of returns. The main theory is that extreme autocorrelation (trending) that coincide with a technical signals such as one from the RSI, may result in a powerful short-term signal that can be exploited.
The indicator is calculated as follows:
- Calculate the price differential (returns) as the current price minus the previous price.
- Calculate the correlation between the current return and the return from 14 periods ago using a lookback of 14 periods.
- Calculate a 14-period RSI on the close prices.
To generate the signals, use the following rules:
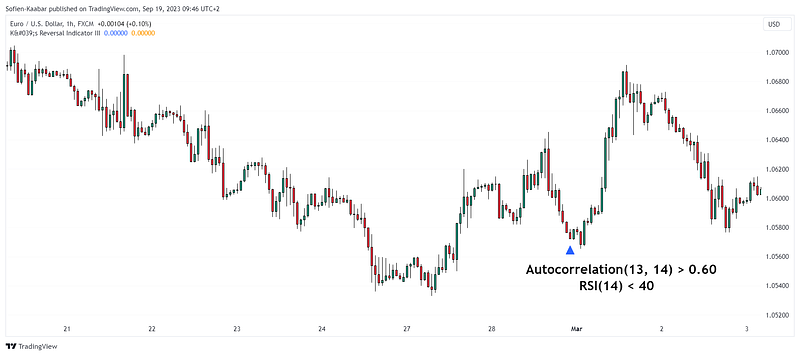
- A bullish signal is generated whenever the correlation is above 0.60 while the RSI is below 40.
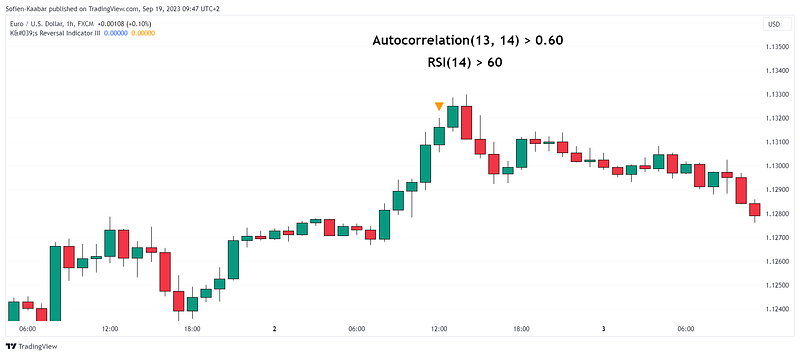
- A bearish signal is generated whenever the correlation is above 0.60 while the RSI is above 60.
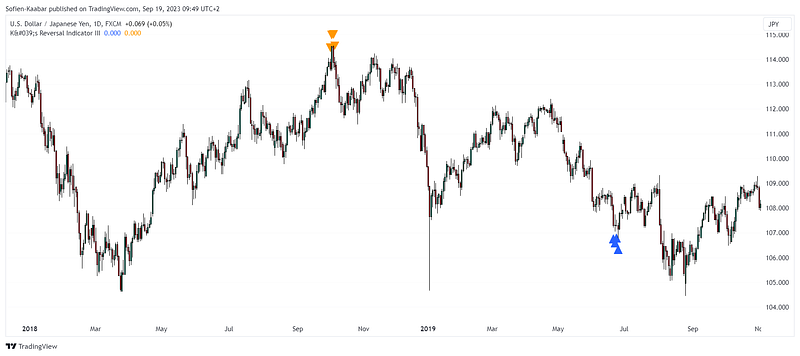
The following chart shows an example of a bullish signal:
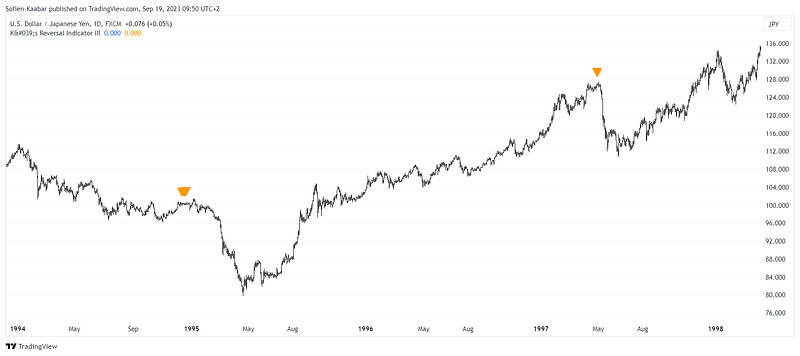
The following chart shows an example of a bearish signal:
This indicator is best suited for short-term reversals, meaning the ones that are limited in nature. It is not meant to show global tops and bottoms, but simply an area of overheating or overstretching which may cause stabilization.
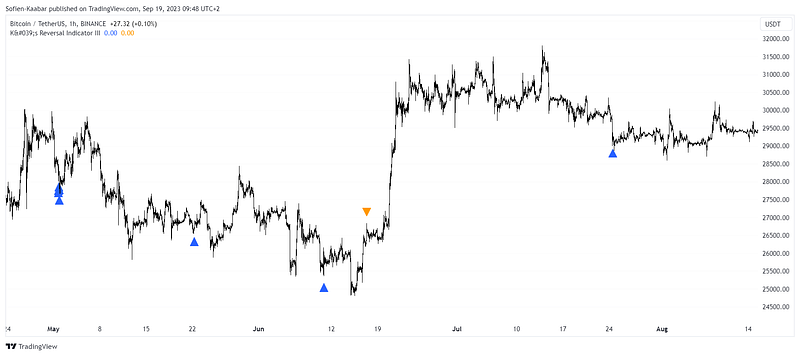
Multiple successive signals from K’s Reversal Indicator III reinforce the conviction of the signal.
Of course, it is not an invincible indicator, as no indicator is invincible, but it does have very good potential in providing value to the trading framework, especially when combined with other K’s indicators.