
Mastering Subplot Legends in Matplotlib

Matplotlib subplots allow you to show several different graphs within a single figure. However, it is often nice to have a shared legend that provides detail on the information displayed in the subplots.
In this article, I explain how to create shared legends, and format them to nicely arrange your subplots. The code used to generate of all the plots shown is included in a Python Notebook at the end of this article.
The problem with a standard approach Legends are usually added to an individual axis in Matplotlib. However, this can often lead to issues when using subplots, or when your plots don’t have much white space. As an example, consider the two plots below:


In the above examples, neither of the subplot axes have space for the legend. Therefore, the best approach is to add a combined legend outside the plots. This can be achieved by adding a legend to the figure, rather than an axis:
from matplotlib.patches import Patch

# Get colours for current style
colours = plt.rcParams['axes.prop_cycle'].by_key()['color']

# Set up handles (the bits that are drawn in the legend) and labels
handles = []
group_labels = []
for group_idx in range(n_groups):
    # Create a simple patch that is the correct colour
    colour = colours[group_idx]
    handles.append(Patch(edgecolor=colour, facecolor=colour, fill=True))
    group_labels.append('Group {:d}'.format(group_idx + 1))

# Acutally create our figure legend, using the above handles and labels
loc='lower center'
ncol=4
fig.legend(handles=handles, labels=group_labels, loc=loc, ncol=ncol)
With this code, we create a custom set of handles and labels that form the legend. Matplotlib provides an overview of how to do this. This leads to the following plot:
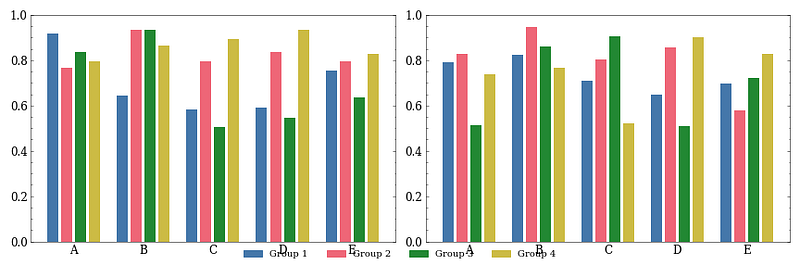
In order to make space for the legend below the subplots, we need to adjust the layout. Matplotlib provides an easy way to do this, using the subplot adjust tool:
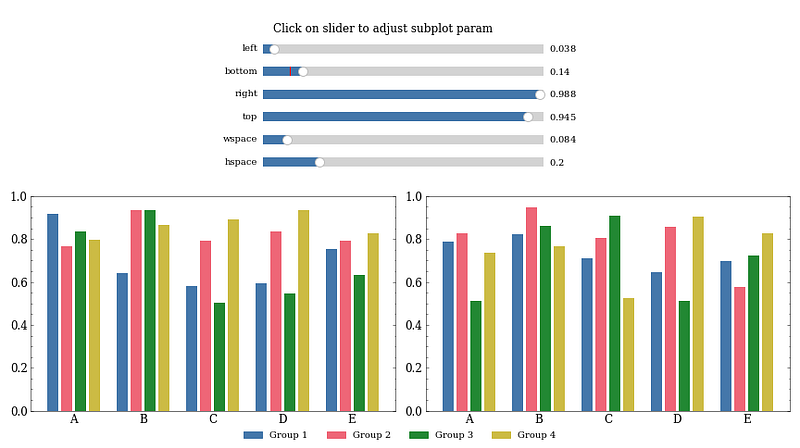
By adjusting the ‘bottom’ parameter, we can shift the subplots up slightly to make space for the legend. Now the figure looks good!
The updated subplot parameters can be set without having to use the subplot adjust tool:
# Tight layout helps remove excess white space in plots
# The subplot must be adjusted after calling this
plt.tight_layout()

# Adjust the subplots with the new bottom values
# This makes space for the legend
plt.subplots_adjust(bottom=0.14)
Obviously you can also find the subplot adjust values via trial and error!
More examples Creating the legends in this way is very flexible. For example, we can add the plot to the right and align it vertically:

This method can also be used with only a single subplot. It’s an easy way to get the legend outside the axis:
from matplotlib.lines import Line2D

# Legend below plot with single axis and lines
line_styles = ['-', ':', '--', '-.']
line_labels = ['Line {:d}'.format(i + 1) for i in range(4)]

# Plot data
fig, axis = plt.subplots(nrows=1, ncols=1, figsize=(6, 4))
lines_xs = np.linspace(0, 1, 100)
axis.plot(lines_xs, lines_xs, ls=line_styles[0])
axis.plot(lines_xs, np.ones_like(lines_xs) * 0.45, ls=line_styles[1])
axis.plot(lines_xs, np.sin(lines_xs * np.pi * 5) / 2 + 0.5, ls=line_styles[2])
axis.plot(lines_xs, np.cos(lines_xs * np.pi * 3) / 6 + 0.2, ls=line_styles[3])

# Add legend
colours = plt.rcParams['axes.prop_cycle'].by_key()['color']
handles = []
for idx in range(4):
    handles.append(Line2D([0], [0], color=colours[idx], ls=line_styles[idx]))
fig.legend(handles=handles, labels=line_labels, loc='lower center', ncol=4)
fig.patch.set_facecolor('white')

# Adjust layout
plt.tight_layout()
plt.subplots_adjust(bottom=0.14)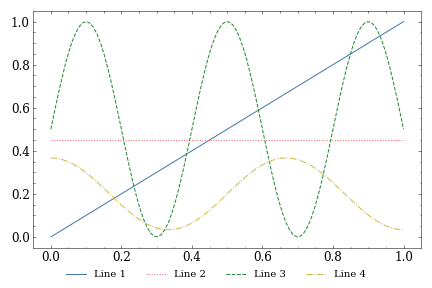
Below is the Python Notebook that I used to generate the plots in this article, which can also be found here.
And that’s my guide on using Mastering Subplot Legends in Matplotlib. If you have any questions, please post a comment or contact me.
Thanks for reading, and happy plotting!
Level Up Coding
Thanks for being a part of our community! Before you go:
- 👏 Clap for the story and follow the author 👉
- 📰 View more content in the Level Up Coding publication
- 💰 Free coding interview course ⇒ View Course
- 🔔 Follow us: Twitter | LinkedIn | Newsletter
🚀👉 Join the Level Up talent collective and find an amazing job


