
Mastering Inset Axes in Matplotlib

Inset axes are a fantastic (and often underutilised) tool in Matplotlib. They can be used to:
- Zoom in on specific parts of plots to show them in greater detail.
- Replace empty space in a plot with additional information.
- Give your figures a little extra zing!
In this article, I go through the basics of using inset axes, and then give extra details on how to customize and improve your plots. The code used to generate of all the plots shown is included in a Python Notebook at the end of this article.
The basics
There are three main components to creating inset axes. First, you need an existing surrounding axis to add the inset axis to. Then, you need to create the inset axis and define where it sits in the surrounding axis. Finally, you need to plot the inset data to the inset axis. An optional step is to add lines to indicate the inset zoom. This can be achieved as follows:
# Code snippet to create inset axes.
# axis is the surrounding axis into which the inset axis will be added
# Create an inset axis in the bottom right corner
axin = axis.inset_axes([0.55, 0.02, 0.43, 0.43])# Plot the data on the inset axis and zoom in on the important part
plot_data(axin)
axin.set_xlim(-10, 12)
axin.set_ylim(0.75, 1.4)# Add the lines to indicate where the inset axis is coming from
axis.indicate_inset_zoom(axin)In the above example, axis.inset_axes creates the inset axis axin and defines where it is positioned in the original axis (more on this positioning later). The region that is shown in the inset axis is controlled by setting the axis limits, i.e., axin.set_xlim and axin.set_ylim — think of this as cropping the original plot so we can zoom in on what’s important. The zoom lines and bounding box are neatly added by just using indicate_inset_zoom.
This gives a result that looks something like this:

The positioning of the inset axis is axes relative. This means the position is independent of the axis limits. The coordinates for the inset axis should be within [0,0] (bottom left) and [1,1] (top right). axis.inset_axes expects four arguments to define the bounds: [x0, y0, width, height]. So, for example, [0.4, 0.4, 0.2, 0.2] gives an inset axis centred in the middle of the plot, regardless of what the axis limits are:

Getting fancy
We can get more creative with our use of inset axes:
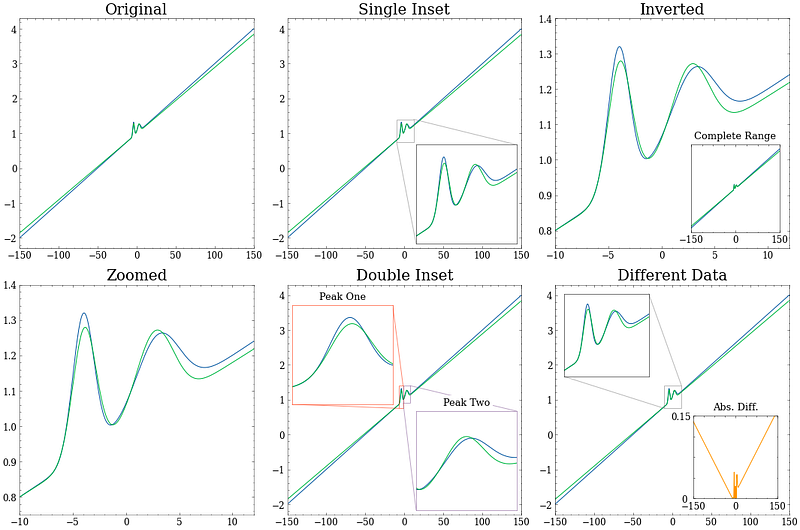
- There is no reason why we can’t have multiple inset axes in our plots. Perhaps there are two regions that we want to zoom in on?
- Sometimes, the content in the inset axis might actually be more interesting that the overall plot. We can swap the content so that the surrounding plot contains the zoomed in version, and the inset axis shows the wider view.
- The inset axis doesn’t even need to show the same data as the surrounding plot. Zooming in is only one use case. Showing additional information is also perfectly fine.
Below we give an example of these different use cases using the same plot that we had above. Look how much better the plots with inset axes look than the boring original plots!
Further Tips
There are a few further things to note when creating inset axes.
Aspect Ratios — It is important to consider the aspect ratio of the inset axis versus the aspect ratio of the original region it is showing. This can lead to stretching or squishing of the original data in the inset axis, which could misrepresent it. For example:

Axis Positioning — Above, I mentioned axes relative coordinates for positioning the inset axes. As an alternative, it is possible to use data relative coordinates. Set transform=axis.transData when creating the inset axes. Watch out though! This makes the position of the inset axes sensitive to the axes limits:

Z Ordering — By default, the inset axis should appear on top of anything you’ve already plotted. However, for manual control, you can adjust the zorder to control what's on top:

Below is the Python Notebook that I used to generate the plots in this article:
And that’s my guide on using Matplotlib Inset Axes. If you have any questions, please post a comment or contact me. Thanks for reading, and happy plotting!


