Marketing Response Curves: The Science of Diminishing Returns and Saturation
Empirically measure diminishing returns and ROI at various advertising spend levels. An excerpt from The Growth Marketing Playbook: A Tactical Guide to Scale E-commerce to $500 Million by Richie Singh.
As a (former) econometrician, I am quite passionate about marketing science and have developed dozens of media mix models (or MMM) for my clients. Media mix models are econometric models that utilize time series regression methods to measure media ROI while adjusting for non-media effects. They continue to be the gold standard for channel level ROI analyses. Back in early 2010, these models started to evolve and be adjusted for digital conversion paths. This allowed for successful use not only for media optimization but also for forecasting.
One of the key outcomes of a media mix model are elasticities or response curves. These establish the ROI based on a best fit line. Depending on the model and vendor, it can be a point elasticity or a full curve. If the data has variance, most modelers can provide a response curve which shows you expected outcomes and ROI at different spend levels. Response curves are best understood via an example.
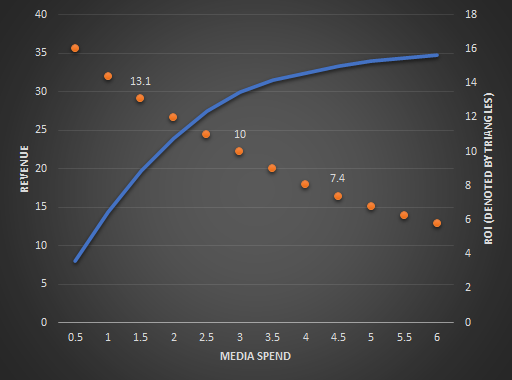
In the figure above, the blue line shows revenue attributed at different levels of annual spend for TV. The orange triangles show ROI and is reflected on the right axis. Currently, the advertiser is spending $3M in media. This is generating $30M in revenue for a ROI of 10. If the budget decreases to $1.5M, ROI increases to 13.1. If the budget increases to $4.5M, the ROI drops to 7.4. The marginal ROI on the incremental $1.5M addition to the $3M base is only 2.2.
There are a couple of applications of a response curve for a growth marketer:
- Identify Saturation Point: In this case the curve is relatively flat around the $5M level. Incremental spend has very minimal revenue impact at that level and ROI tends to flat-line.
- Optimize Media-Mix: For example, if you are currently at $3M and had another $1.5M to deploy, you know the marginal ROI on TV is 2.2. You can then consider response curves from other channels and find the channel where you have the highest ROI for the incremental $1.5M.
- Triangulate Measurement: These curves are helpful for financial planning as well as triangulating the impact of media, especially upper funnel tactics.
Anatomy of a Response Curve
Now that we understand how valuable these curves are, let’s review the constituents of a response curve. There are three important aspects of a response curve:
- Diminishing Returns: This is a measure of the amount of headroom that remains. It accounts for the fact that after a certain point, each additional dollar you spend has relatively lower impact. This is empirically measured by the model.
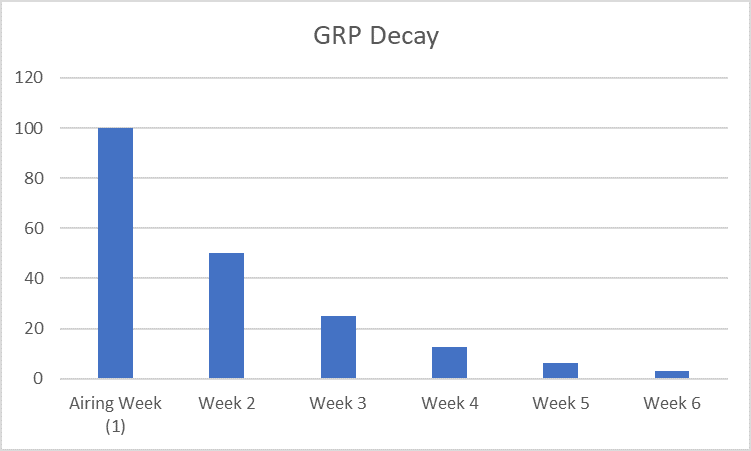
- Ad-stock Decay or Carryover: Most media channels have two impacts. Contemporaneous Impact is the impact of advertising in the time period the ad airs. Lagged Impact is the impact of advertising in future time periods.
To measure this time delayed impact, marketing scientists use a technique called Ad-stock Decay. This is empirically determined by the model and allows for attribution of the carryover impact of media. To take an example, let’s assume a brand had a TV buy of 100 GRP (Gross Rating Points). In week two, (one week after the airing week), there will be some carryover impact. Utilizing a 50% decay rate, that impact is measured as 50 GRPs. In week three, this reduces another 50% to 25 GRPs and so on.
The example used is of a simple model. There are also distributed lag models that use different decay factors for different periods.
Ad-stocking is a tried and tested technique for media measurement. The exact decay and saturation rates vary from brand to brand. This is why it’s best to empirically measure them. However, there are some patterns that are true for most brands. Mass media tends to have the highest rate of carryover. Brand building campaigns have a higher carryover impact than promotional campaigns.
For a more technical discussion, consult Understanding the Role of Adstock in Advertising Decisions (2011), by Gijsenberg, Maarten & van Heerde, Harald & Dekimpe, Marnik & Nijs, Vincent. SSRN Electronic Journal.
3. Control for Non-media Factors: Media mix models allow analysts to control for non-media factors like seasonality, weather, market competition etc. This ensures that the curve is not stealing credit from other factors.
The example above is a convex response curve. In literature, you will also find a response curve that is shaped like a S or a sigmoid function.
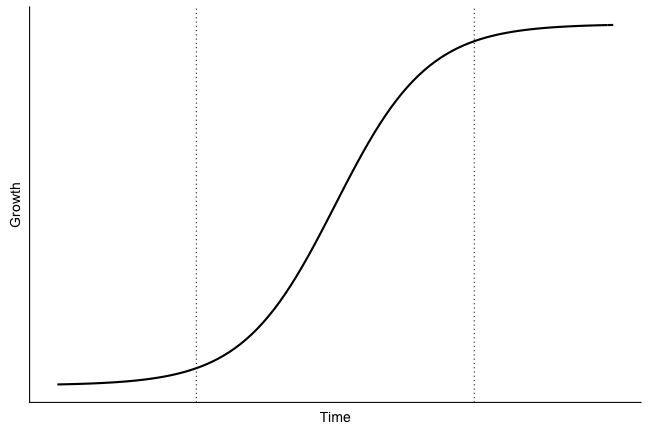
The logic for S curves is that in the initial stages, you need a certain amount of weight to get scale and frequency. This is the reason why certain agencies recommend a minimum media weight or spend level for a channel. I wholeheartedly agree with the theory. However, it is rare to empirically measure an S-curve as it requires significantly more variance in the data to reliably build it.
Now that you are thinking about your media in terms of response curves, the natural next question is how do you get response curves for your channels?
If you are run rating above $100M and have 2 years of data, the time is ripe for investment in a media mix model. Good models require a lot of effort for data collection and processing, so factor in a few months and a six-figure investment.
If you don’t satisfy those conditions, there is a hacker way to build approximate directional response curves. This and many more tips are covered in my comprehensive book on growth marketing, now available on Amazon.

Excerpted from The Growth Marketing Playbook: A Tactical Guide to Scale E-commerce to $500 Million by Richie Singh. The complete book dives into 50+ tactics across 5 strategic pillars of Measurement, Acquisition, Lifecycle Marketing, CRO & Brand. Learn more on Amazon.