
Marketing Channel Attribution with Markov Chains in Python — Part 2: The Complete Walkthrough

Markov chains, in the context of channel attribution, gives us a framework to statistically model user journeys and how each channel factors into the users traveling from one channel to another to eventually convert (or not). By using these transition probabilities, we can identify the statistical impact a single channel has on our total conversions.
For more details on marketing attribution and Markov Chains, see part 1.
In part 1 on this subject, we covered what marketing attribution is, why accurate and correct attribution is increasingly important and how the theory behind Markov Chains can be applied to this domain.
While that article contained a practical example of how to programmatically apply Markov Chains to an example customer data set in Python, it also involved a heavy dependency on the R package ChannelAttribution.
For production application, this level of dependency on a separate software and language is not ideal, and instead, we’d want to keep the entire attribution process in a single application — in this case Python.
In this article, I’ll go through practical code examples on how we can achieve that.
Data
For this updated walkthrough I have updated the data set to be more aligned with the data formats we’d likely encounter in an actual production environment. The data set can be downloaded here.
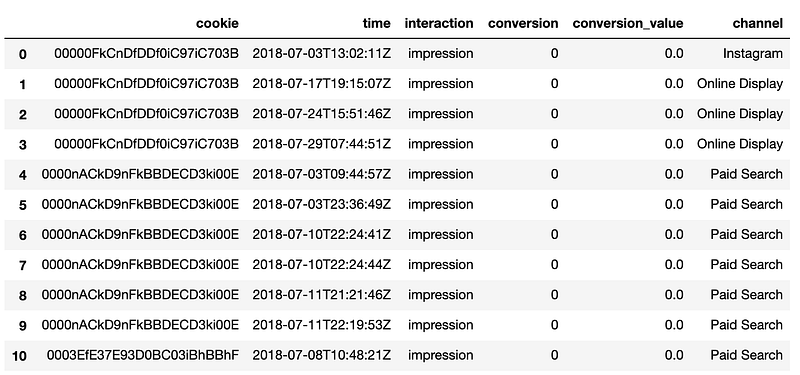
For every unique customer and visit our data set this time around contains the following information in every row:
- Cookie: Randomly generated customer id enabling us to tie subsequent visits back to the same customer
- Timestamp: Date and time when the visit took place
- Interaction: Categorical variable indicating the type of interaction that took place
- Conversion: Boolean variable indicating whether a conversion took place
- Conversion Value: Value of the potential conversion event
- Channel: The marketing channel that brought the customer to our site
The data set contains ~586,000 marketing touch-points for ~240,000 unique customers which resulted in ~18,000 thousand conversion events. In tabular format the data set will look like this:
Data Preprocessing
To get our data into a format that’s ideal for applying the Markov Chain algorithm, we’ll need to do a bit of preprocessing.
We’ll start by importing pandas, loading in our data set and creating a column indicating the order of the touch-points for each user:
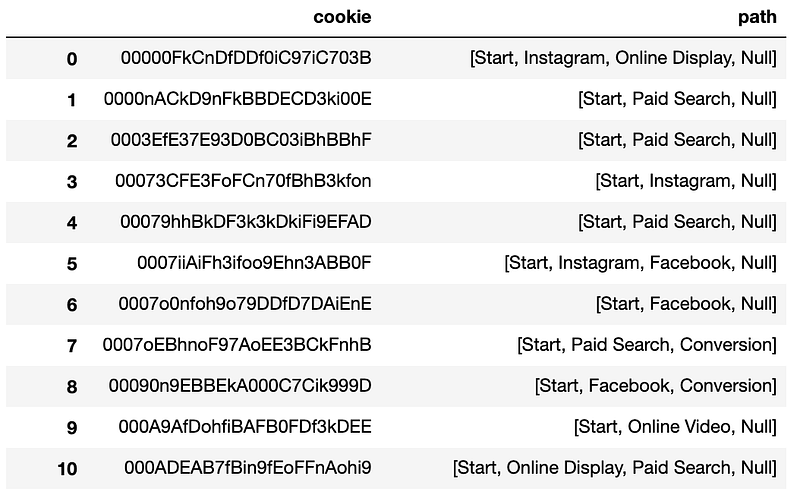
Next, we’ll want to format the data frame from long-form to wide-form, so we’ll ultimately end up with a data frame containing a single row per user and the total chronological user-journey in a list of touch-points.
We’ll do this by first grouping the chronological touch-points into a list, merging the list of final conversion/non-conversion events onto that data frame and finally adding a “Null” or “Conversion” event to the end of our user-journey lists.
That should gives us a data frame that looks like this:
Markov Chains
We can now move onto the actual Markov Chain method.
The algorithm for Markov Chains can be summarized in 2 steps:
- Calculate transition probabilities between all states in our state-space
- Calculate removal effects (for more info on removal effects, see part 1)
We’ll start by defining a list of all user journeys, the number of total conversion and the base level conversion rate. All things we’ll make use of later:
Next, we’ll define a function that identifies all potential state transitions and outputs a dictionary containing these. We’ll use this as an input when calculating transition probabilities:
And the function to calculate all transition probabilities can be defined as:
The above should leave us with a dictionary containing all transitions and their respective transition probabilities given our historical data.
The final step is then to identify removal effects for each of our marketing channels. To do this we’ll make use of linear algebra and matrix manipulations, therefore let’s turn our above transition probabilities dictionary into a data frame (matrix):
The transition matrix we just produced actually holds a great deal of valuable information on its own. An immediate derivative of it would be to generate a directional graph or transition heat map to visualize the typical user journeys.
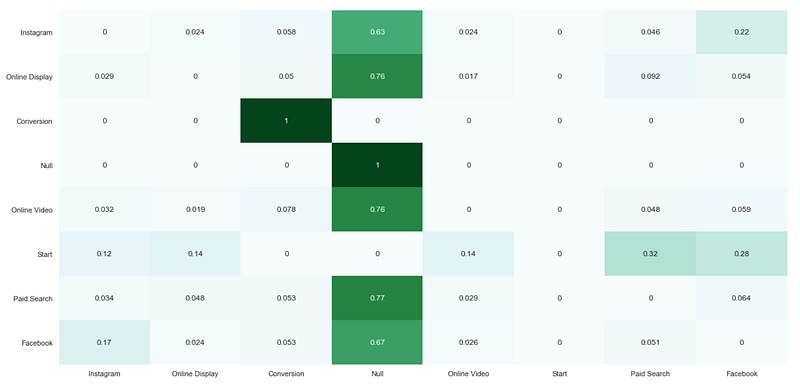
Using historical context and the heat map above we not only gain insights into how each marketing channel is driving users towards our conversion event, but we also gain critical information around how our marketing channels are interacting with each other. Given today’s typical multi-touch conversion journeys this information can prove to be extremely valuable and allows us to optimize our multi-channel customer journeys for conversion.
We can now iteratively go through each of our channels and assess the impact it would have on overall conversion if we were to remove a channel from our state-space. We’ll do this and add the resulting removal effects to an output dictionary:
The resulting removal effects dictionary can then be used to calculate the Markov Chain attributions for each of our marketing channels:
To get a better feel for the output of our labor, let’s visualize the final attributed conversion values for each channel.
If you’ve been following along with our original data set you should be left with the following bar chart indicating the total number of conversion attributed to each channel by the Markov Chain algorithm:
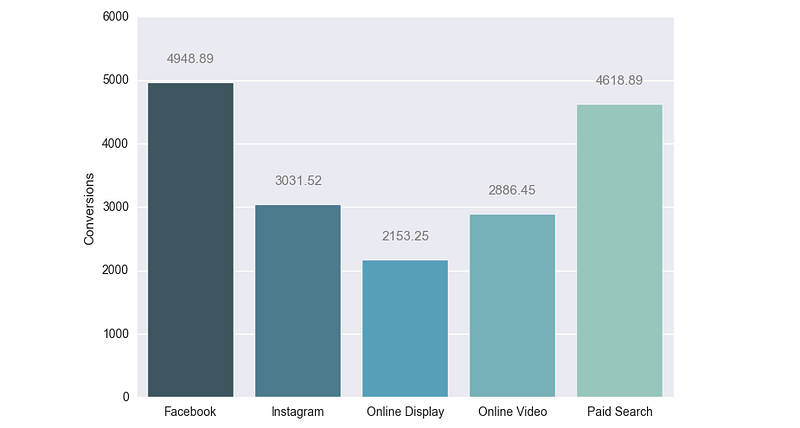
It’s important to keep in mind that while the data set in this example holds a sizeable volume of data it only includes 5 marketing channels. In a real-world scenario we’d likely be working with several times that number of channels (significantly more if we applying a more granular model such as a campaign specific attribution model), consequently increasing the complexity of the typical user journey and the need for an attribution model that favours this level of complexity.
Assigning accurate credit to marketing channels can be a complex but rewarding task. Using the Markov Chain approach outlined in this article will allow your attributions to more accurately reflect how your users are interacting with your marketing.
About the Author
Morten works as a Data Scientist at Wealthsimple where he uses data science to help people achieve financial freedom.
The Data Science team at Wealthsimple is always looking for new innovative, smart and ambitious people to join the team. Check out our career page or reach out on LinkedIn.


