
Mapping GIS Data on a Basemap by Contextily in Colab
Nowadays many online apps are map-based applications, such as Uber, how to map GIS data on a basemap is an important knowledge in developing apps. Very often, data providers would only provide GIS data with coordinates or polygons’ coordinates, and a basemap is required to be layered (matched) to show a map. Depending on different purposes, various types of basemap are used. For example, Open Street Maps are more commonly used to show spatial relationships by roads and streets, Stamen Terrain Maps are better for showing contours and land use patterns. This article shows how to map GIS data on different basemaps by using Contextily in Colab.
We have already discussed how to map by geopandas in colab before (Yiu, 2021), but it is based on the maps provided by geopandas’ datasets and cannot be changed. Here we show how to download GIS data from a public website and then map them on a basemap.
- The first step is always installing software, here we install geopandas and contextily.
# plot GIS data on different basemaps by geopandas and contextily
# see https://colab.research.google.com/github/bwsi-hadr/03-Intro-to-GIS/blob/master/03_Intro_to_GIS.ipynb#scrollTo=aOtbuNGUTB7k
!pip install geopandas
!pip install contextily
import geopandas as gpd
import contextily as ctx # for basemaps2. Then we collect a shape file (.shp) of the locations of HOS courts in Hong Kong provided by ESRI. The website is called “Open Geo-Spatial Data in Hong Kong” which provides 14 categories of GIS data. Here I explore the category of “Housing” where includes many different datasets. HOS Courts in Hong Kong is just one of them as shown in Figure 1.
Here I save the shp file to my google.colab drive first, and define the filepath as the filename and use geopandas to read the file.
#get a shape file
#Hong Kong shp file from https://opendata.esrichina.hk/
from google.colab import drive
drive.mount('/content/drive/')#filepath = "Home_Ownership_Scheme_Courts_in_Hong_Kong.shp"data = gpd.read_file("drive/MyDrive/Colab Notebooks/Home_Ownership_Scheme_Courts_in_Hong_Kong.shp")
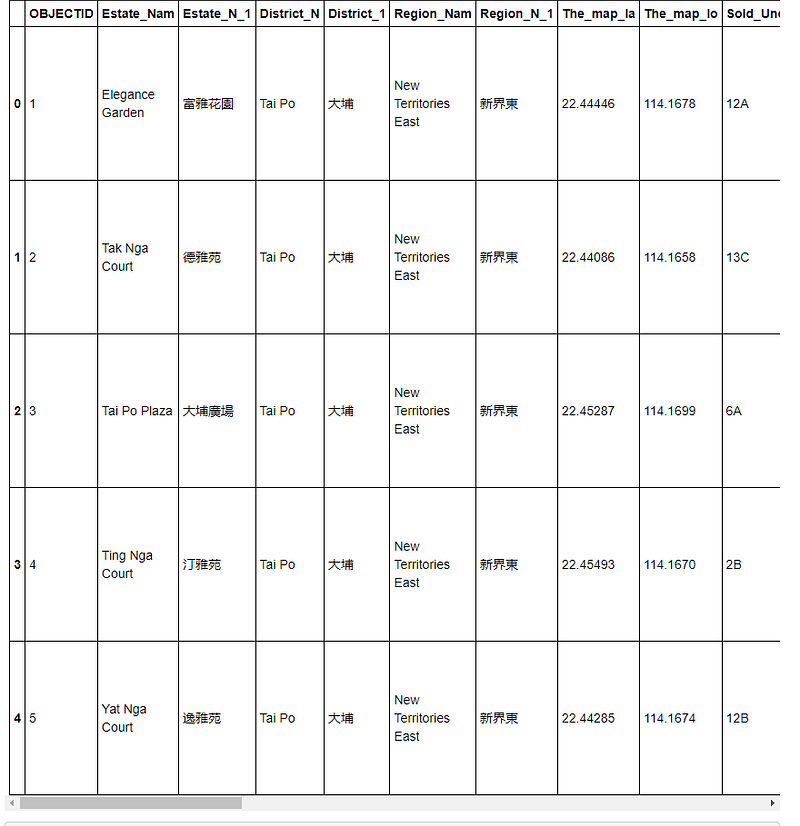
data.head()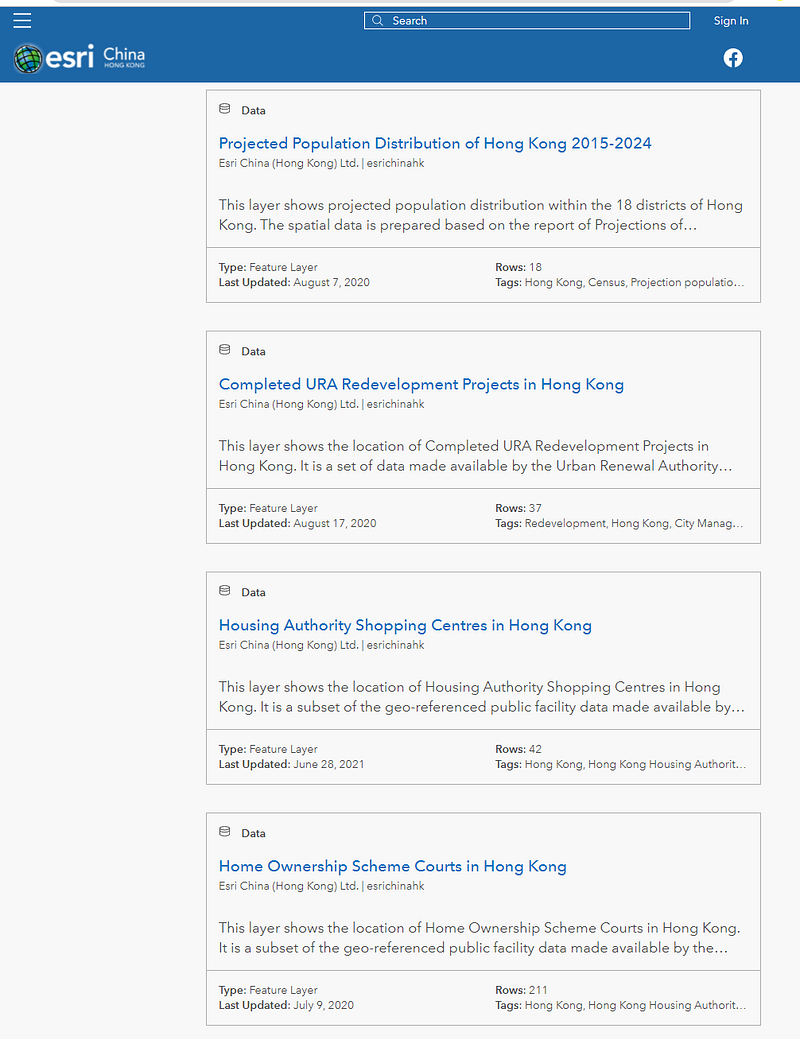
The table is quite big to show here, the following just shows the first 5 rows and the leftmost 10 columns (Figure 2). For the purpose of this article, the most important two columns are The_map_la and The_map_lo which indicate the latitude and longitude (i.e. coordinates) of the court.
3. If we just plot the GIS data by their coordinates as follows, it will show the dots only and not a map (Figure 3). You are free to set the x, y limits.
#plot the GIS data by coordinatesax = data.plot(figsize=(10,5))
ax.set_xlim([113.8,114.3])
ax.set_ylim([22.20,22.55])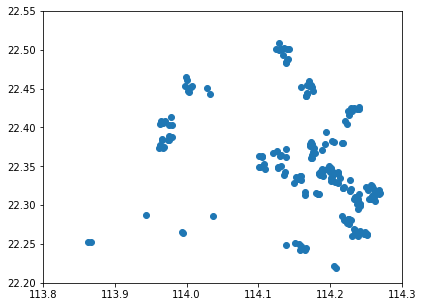
4. Since it is about the locations of housing estates, I try using Open Street Map as the basemap, and the result is as follows (Figure 4):
#use a basemap of OpenStreetMap.Mapnikax = data.plot(figsize=(10,10), legend=True)
ctx.add_basemap(ax, crs=data.crs, source=ctx.providers.OpenStreetMap.Mapnik)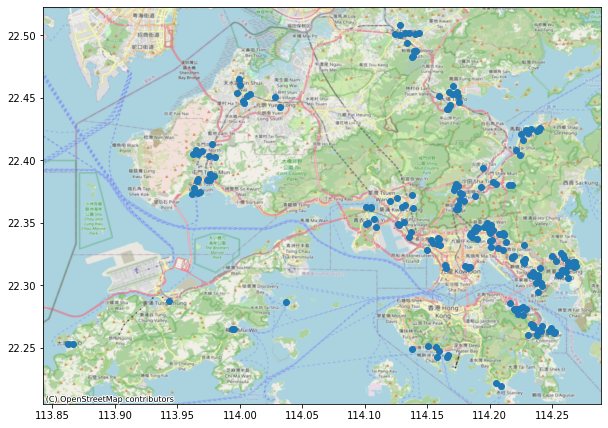
5. I also try mapping them on a Stamen Terrain map, see which one is better?
#use another basemap Stamen.Terrainax = data.plot(figsize=(10,10), legend=True)
ctx.add_basemap(ax, crs=data.crs, source=ctx.providers.Stamen.Terrain)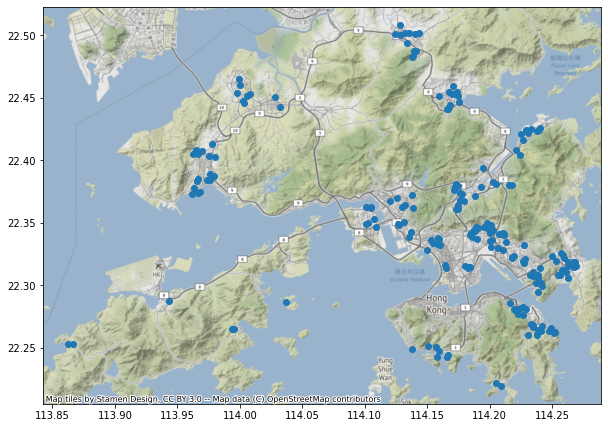
There are many other basemaps that you can choose. For more information on different basemaps in Contextily, you may refer to Hamed (2020). For an introduction guide to contextily, you may browse through https://contextily.readthedocs.io/en/latest/intro_guide.html
The coding of this article is saved in my github-GreatLab at https://github.com/Chung-collab/GREAT-LAB/blob/main/GIS_data_on_basemap.ipynb, and a youtube is available at Yiu (2021b)
Here I show one more example of mapping shaded areas rather than dots by using Wellington Ground Shaking Hazard Zones data available at https://data-gwrc.opendata.arcgis.com/datasets/GWRC::wellington-region-ground-shaking-hazard-zones/about
Simply change the data file downloading routine to the following:
#get a shape file
#Wellington Quake Risk Zones shp file from https://data-gwrc.opendata.arcgis.com/datasets/GWRC::wellington-region-ground-shaking-hazard-zones/about
from google.colab import drive
drive.mount('/content/drive')
data = gpd.read_file("drive/MyDrive/Colab Notebooks/Wellington_Region_Ground_Shaking_Hazard_Zones.shp")
data.head()
The result is a table of geometry polygons for different quake risk severity. Let’s map the severity level (ZONE) by various colours on a terrain basemap.
The code is almost the same as above, simply adding a column=”ZONE” and cmap=’OrRd’ for orange colour, adding legend=True and including a map title with a vertical colour bar to show 1–5 severity level by adding legend_kwds={‘label’: “Wellington Region Ground Shaking Hazard Zones”, ‘orientation’: “vertical”}
ax=data.plot(column="ZONE", figsize=(25,12.5), cmap='OrRd', legend=True, legend_kwds={'label': "Wellington Region Ground Shaking Hazard Zones", 'orientation': "vertical"})
ctx.add_basemap(ax, crs=data.crs, source=ctx.providers.Stamen.Terrain)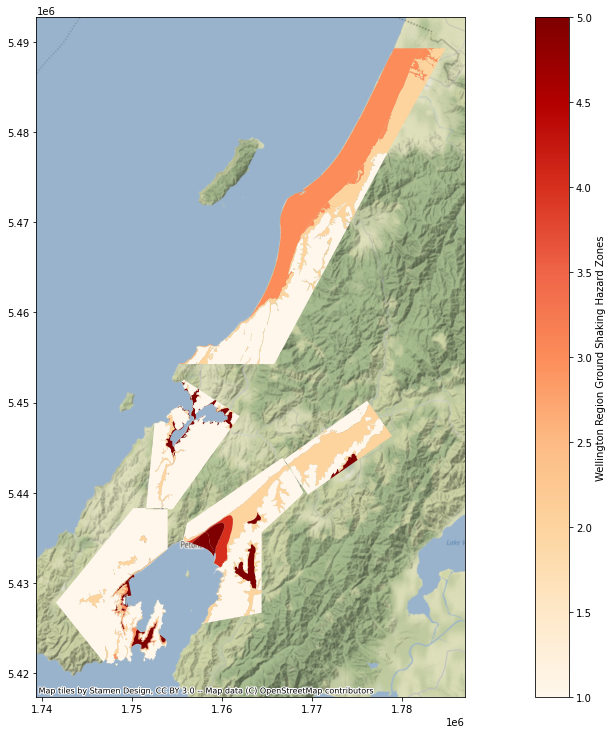
The 3rd example is plotting Wellington’s flood zones as follows:
#get a shape file
#Wellington Flood Zones shp file from #Wellington Flood Zone shp file from https://data-wcc.opendata.arcgis.com/datasets/WCC::flood-zones-3/about
from google.colab import drive
drive.mount('/content/drive/')
#filepath = "Flood_Zones.shp"
data = gpd.read_file("drive/MyDrive/Colab Notebooks/Flood_Zones.shp")#plot without basemap
ax = data.plot(figsize=(15,10))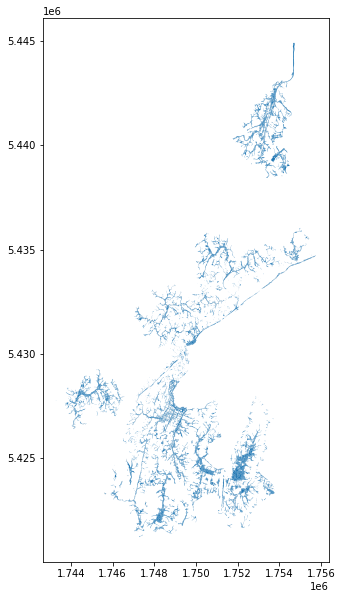
#plot with a basemap
ax = data.plot(figsize=(55,35))
ctx.add_basemap(ax, crs=data.crs, cmap='Blues', source=ctx.providers.Stamen.Terrain)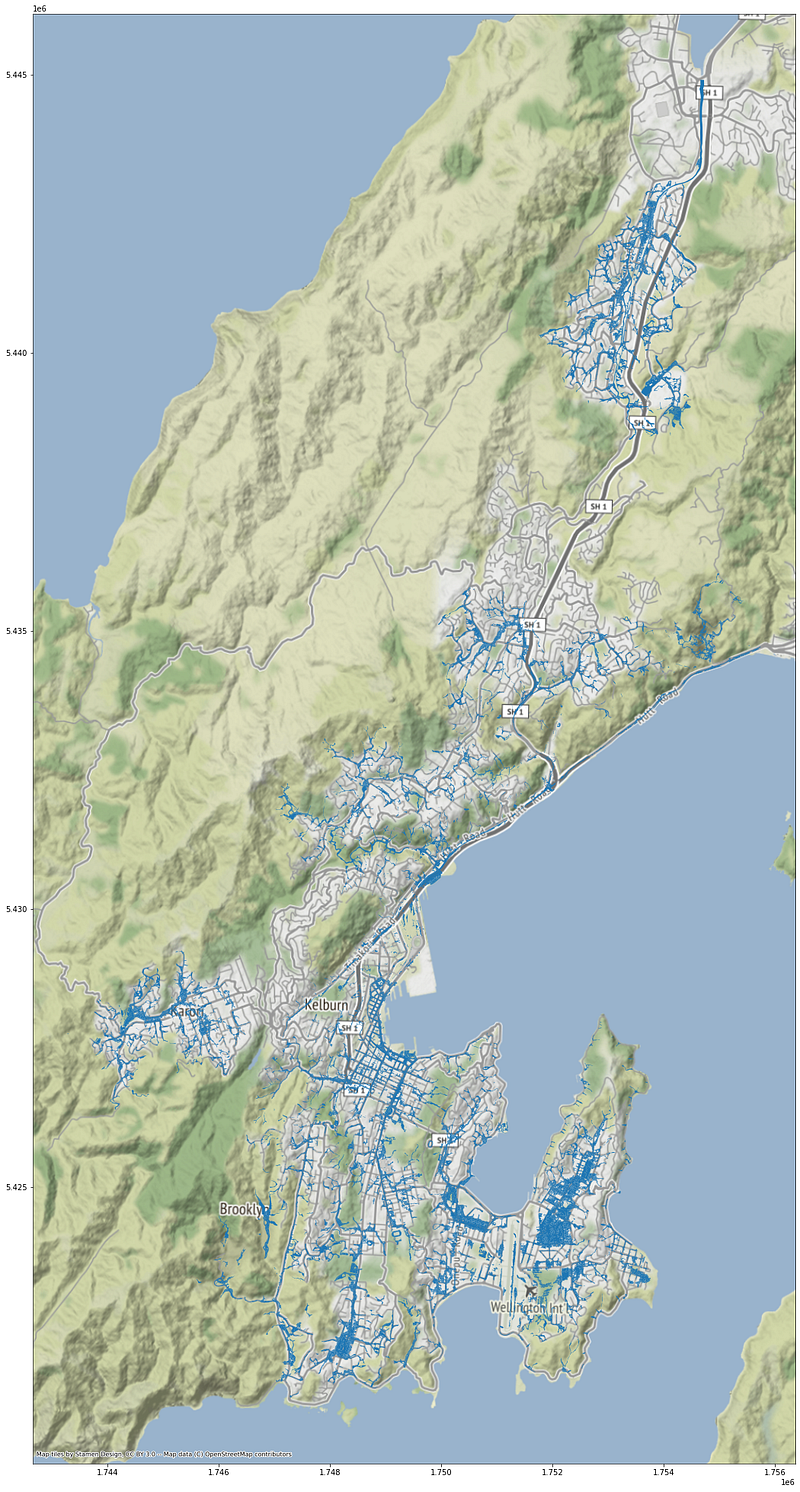
see github: https://github.com/Chung-collab/GREAT-LAB/blob/main/GIS_data_on_basemap.ipynb
If you want to have a more advanced example of mapping datasets by contextily, here is the website showing how to plot the Earthquakes>4.5 in the past 30 days in the world. https://www.stat.berkeley.edu/~nelle/teaching/2017-visualization/README.html
References
Hamed, W. (2020) Free base-maps for static maps using Geopandas and Contextily, Medium, June 6. https://towardsdatascience.com/free-base-maps-for-static-maps-using-geopandas-and-contextily-cd4844ff82e1
Yiu, C.Y. (2021a) Mapping by Geopandas in Colab, Medium, June 12. https://ecyy.medium.com/mapping-by-geopandas-in-colab-fe4b63b9ac00
Yiu, C.Y. (2021b) Mapping GIS Data on a Basemap by Contextily in Colab, Youtube, June 30. https://youtu.be/fZ12UJ9G6js


