
Finance
Manage Your Trading Risks with Support and Resistance
Start your analysis with python
In stock market analysis, Support and Resistance levels are fundamental concepts that help traders determine the price points that change market behavior. In this story, we will discover support and resistance, their significance, and how to find them using Python.

What are Support and Resistance Levels:
Support levels are prices at which a stock has more interest in buying preventing it from falling further down. In contrast, resistance levels are prices at which a stock starts to face the selling pressure preventing it from growing further up.
Significance of Support and Resistance Levels:
- Entry and Exit Points: Traders use these levels to determine their entry and exit points. Support levels are good to buy and resistance levels are good to sell to increase the reward for traders.
- Risk Management: A stop-loss order near the support price and a take-profit order near resistance levels help to manage the risk
- Trend Analysis: Support and Resistance helps to determine the strength of the trends. If the price goes below the support levels it may indicate a downtrend and if the price goes above the resistance levels it may indicate an uptrend.
- Historical Reference: These levels provide historical context and help predict future predictions
Support and Resistance Levels Using Python
In the example, we will use Python with pandas library for data manipulation and matplotlibfor data visualization. We will use Yahoo finance data for the price. I have used Apple stock in this example please free to use it against the stock of your choice.
1. Data Collection
Install the libraries required and fetch historical stock price data:
import pandas as pd
import yfinance as yf
# Replace 'AAPL' with your stock symbol and adjust the date range as needed
df = yf.download('AAPL', start='2022-10-22', end='2023-10-22')
2. Plot the Stock Price Data:
Visualize the stock price data to get a sense of price movement:
import matplotlib.pyplot as plt
plt.figure(figsize=(12, 6))
plt.plot(df['Close'], label='Stock Price')
plt.title('Stock Price Chart')
plt.xlabel('Date')
plt.ylabel('Price')
plt.legend()
plt.show()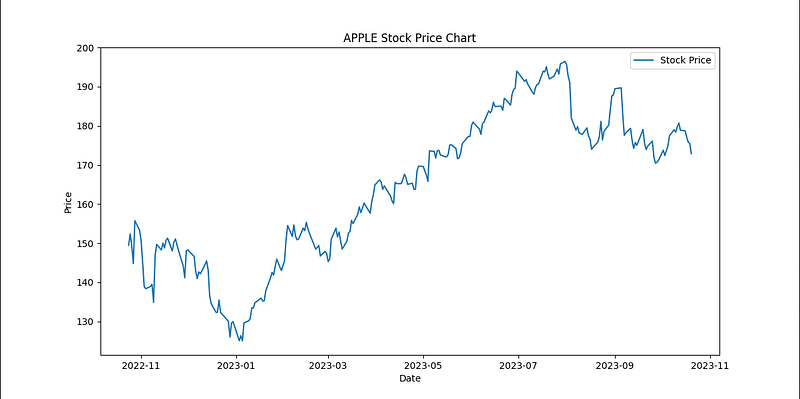
3. Find Support and Resistance Levels:
To find these levels, calculate rolling highs and lows over a specific period (e.g., 30 days):
window = 30  # Adjust the window size as needed
df['Support'] = df['Low'].rolling(window=window).min()
df['Resistance'] = df['High'].rolling(window=window).max()
4. Plot Support and Resistance Levels:
Visualize the support and resistance levels on the stock price chart:
plt.figure(figsize=(12, 6))
plt.plot(df['Close'], label='Stock Price')
plt.plot(df['Support'], label='Support Level', linestyle='--')
plt.plot(df['Resistance'], label='Resistance Level', linestyle='--')
plt.title('Support and Resistance Levels')
plt.xlabel('Date')
plt.ylabel('Price')
plt.legend()
plt.show()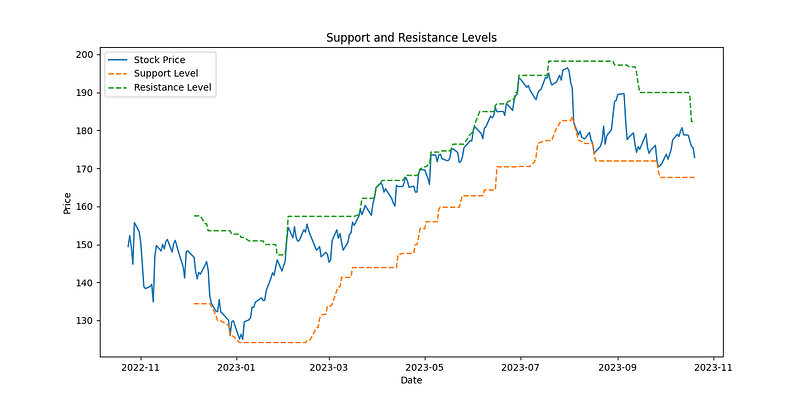
Bottom Line
Understanding support and Resistance Levels helps us to make important decisions in the stock market. With Python, we can easily visualize these levels and determine our trading strategies and risk management.
Disclaimer: Please be aware that the above content is for educational purposes only, and it does not constitute financial advice. This article serves as an exploration of the terms, their significance, and their practical application using Python.
Originally published at https://ethigeek.com.
Thank you for your comments and for sharing my stories to reach a broader audience.
If you like my article and would like to support me, make sure to:


