
Making Sense of Logging Configurations in Spring Boot
Take control of your logger pattern
Background
Java logging ecosystem is one of the most overly complex systems compared to its counterparts in other popular programming languages. I believe that no one should spend their precious time just understanding how various libraries can be set up, but here we are.
I am no expert in Java logging ecosystem and its history but let me quickly summarize the big picture. Java logging frameworks primarily consists of three systems. API, Facade, and Logging Implementation.

Logging API
This is what Logger you use.
e.g)org.slf4j.Logger java.util.logging.Logger org.apache.logging.log4j.Logger
Facade/Bridge
This can chain the API to the actual implementation of logging. Why do we even need this? It’s because on every release of new libraries, each wanted to be able to support existing codes that were written with older/different API spec. Also, some libraries chose to focus only on APIs whereas other libraries only chose to focus on implementations. AND for the purpose of extensibility and freedom (sarcasm), facade abstracts the implementation from API.
Implementation
This receives the logging request and actually performs the logging. This is what you need to configure in terms of what in which format logs to where
Not bad you may think, but for historical and other reasons that I only partly understand, there are just so many variations of API, Facade, and Implementation.
Here are some examples of unnecessary and quirky examples of logging set up.
API: log4j(1)   Facade: log4j   Implementation: log4j2
API: slf4j      Facade: slf4j   Implementation: log4j
API: java.util  Facade: slf4j   Implementation: logback
API: commons    Facade: slf4j   Implementation: logback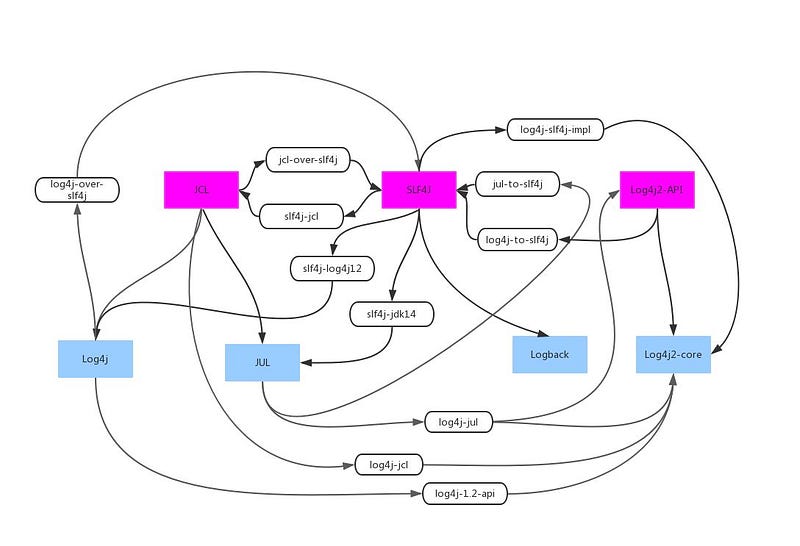
Now that dust has settled. We don’t have to worry about most other setups. SLF4J is now the most widely used API and Facade/Bridge. LogBack and Log4j2 are the top choices for the implementation. Most popular setups nowadays are:
API: SLF4J Facade: SLF4J Implementation: Logback
API: SLF4J Facade: SLF4J Implementation: Log4j2
API: Log4J2 Facade: None Implementation: Log4j2
As a matter of fact, Spring Boot (Starter) uses
API: SLF4J Facade: SLF4J Implementation: Logback
(BTW, It’s not same on plain Spring or Spring Boot without Starters)
Spring Boot Log Configurations
Just to reiterate, if you are using Spring Boot through one of the starters, it will be preconfigured to use Slf4J as API and Logback as Implementation. In other words, you will useorg.slf4j.LoggerFactory and org.slf4j.Logger to construct and emit log statement, respectively. For configuration of the logging implementation, you will use Logback.
For basic configurations, you should be able to configure most settings without using any Logback specific configurations by simply defining some properties in your configuration files.
Log Levels
Snippet from Spring Boot Doc explains
All the supported logging systems can have the logger levels set in the Spring
Environment(for example, inapplication.properties) by usinglogging.level.<logger-name>=<level>wherelevelis one of TRACE, DEBUG, INFO, WARN, ERROR, FATAL, or OFF. Therootlogger can be configured by usinglogging.level.root.
For example, following configuration will have WARN as default level meaning only WARN, ERROR, FATAL level logging will be logged by default. Whereas logs from Spring Web package will log DEBUG, INFO, WARN, ERROR, and FATAL. And ERROR and FATAL from Hibernate packages.
logging.level.root=warn
logging.level.org.springframework.web=debug
logging.level.org.hibernate=error
Log Output Pattern
You can also override the logging pattern through properties:logging.pattern.console and logging.pattern.file
The Spring Boot’s default configuration is as follows.
${CONSOLE_LOG_PATTERN:-%clr(%d{${LOG_DATEFORMAT_PATTERN:-yyyy-MM-dd'T'HH:mm:ss.SSSXXX}}){faint} %clr(${LOG_LEVEL_PATTERN:-%5p}){} %clr(${PID:-}){magenta} %clr(--- %esb(){APPLICATION_NAME}%esb{APPLICATION_GROUP}[%15.15t] ${LOG_CORRELATION_PATTERN:-}){faint}%clr(%-40.40logger{39}){cyan} %clr(:){faint} %m%n${LOG_EXCEPTION_CONVERSION_WORD:-%wEx}}There are Spring system properties that can be used to further change the default behavior. They are. Check out some other logging related system properties, here.
CONSOLE_LOG_PATTERN
LOG_DATEFORMAT_PATTERN
LOG_LEVEL_PATTERN
LOG_CORRELATION_PATTERN
LOG_EXCEPTION_CONVERSION_WORD
LOG_CORRELATION_PATTERN
If we don’t override any of them, we are simply left with the following
%clr(%d{yyyy-MM-dd'T'HH:mm:ss.SSSXXX}){faint} %clr(%5p){} %clr(${PID:-}){magenta} %clr(--- %esb(){APPLICATION_NAME}%esb{APPLICATION_GROUP}[%15.15t] ){faint}%clr(%-40.40logger{39}){cyan} %clr(:){faint} %m%n%wExLet’s go over dissect each part. For FULL list of all patterns, see LogBack Documentation, here.
Timestamp
%clr(%d{yyyy-MM-dd’T’HH:mm:ss.SSSXXX}){faint}
%d{...}: Outputs the date and time of the log event in the specified format.yyyy-MM-dd'T'HH:mm:ss.SSSXXX: Formats the date and time in ISO 8601 format with milliseconds and timezone.%clr(...){faint}: Colors the enclosed text with a faint color for visual distinction.
Log Level
%clr(%5p){}
%5p: Outputs the log level (e.g.,INFO,DEBUG), right-aligned in a field of five characters.%clr(...){}: Colors the enclosed text based on the log level severity.- Empty braces
{}mean the color is determined by the log level: -ERROR: Red -WARN: Yellow -INFO: Green| -DEBUG: Blue -TRACE: Faint
Process ID (PID)
%clr(${PID:-}){magenta}
${PID:-}: This syntax means "use the value ofPIDif set; otherwise, use an empty string."%clr(...){magenta}: Colors the enclosed text in magenta.
Application Info
%clr( — — %esb(){APPLICATION_NAME}%esb{APPLICATION_GROUP}[%15.15t] ${LOG_CORRELATION_PATTERN:-}){faint}
%clr(...){faint}: Colors the enclosed text in a faint color.---: Literal separator string.%esb(){APPLICATION_NAME}: Application name. Usually set thru properties such asapplication.name=MyApp%esb{APPLICATION_GROUP}: Application group. Usually set thru properties such asapplication.group=MyGroup[%15.15t]: Outputs the thread name, padded/truncated to 15 characters.
Log Correlation Id
If you are using tracing, then you can set the correlation id pattern using properties as follows
logging.pattern.correlation=[${spring.application.name:},%X{traceId:-},%X{spanId:-}]
Logger Name
%-40.40logger{39}
%-40.40: Left-aligns the output in a 40-character field, truncating if necessary.logger{39}: Outputs the logger name (usually the fully qualified class name).{39}Shortens package names to their first letter, limiting the total length to 39 characters.- Example:
com.example.project.service.MyServicebecomesc.e.p.s.MyService. %clr(...){cyan}: Colors the enclosed text in cyan.
Seperator
%clr(:){faint}
- Separator
:in faint color
Log Message and New Line
%m%n
%m: Outputs the log message.%n: Outputs a new line character.
Exception Stack Trace
%wEx
%wEx: Outputs the exception stack trace if an exception is logged, including packaging data.wpart makes stacktrace to be line wrapped.
MDC
Mapped Diagnostic Context (MDC) is a mechanism provided by logging frameworks like Logback and SLF4J that allows you to store contextual information on a per-thread basis. This information can then be included in your logs, which is particularly useful in multi-threaded applications or when processing multiple requests simultaneously.
For Example, you may want to insert the userId of the user that invoked the REST endpoint.
// Most likely using some filter pattern.

// You can set additional MDC properties
String userId = getCurrentUserId();
MDC.put("userId", userId);
From the time of the execution of the MDC.put function, every log statement from that point will include userId value until the thread is released after response is returned to the user. Use %X{key} in your logging.pattern.console property to include MDC values.
For example,
logging.pattern.console=... userId: %X{userId} ...Custom Formats
Let’s discuss some situations that may require you to modify the default patterns.
Tweaking the Existing Patterns
Depending on your needs, you may want to tweak the existing pattern. In my experience, tweaking the pattern has been useful for running automated testing. For example, let’s say you run hundreds of automated tests as part of some CI/CD pipeline. Some tests also expect specific exceptions to be thrown in certain cases, but you do not want the logs from test results to be overtaken by all the exception stacktraces. In that case, you can control the size of the stacktrace lines by simply attaching the size to the exception pattern of Logback; %wEx{5} effectively only logging 5 lines. You can similarly change the effective size of other parts. Refer to Logback documentation for various options.
JSON Pattern
If you are pushing the logs to enterprise log management platforms such as Datadog, SumoLogic, or Splunk, it is usually preferred or required to emit the logs as JSON format so further parsing and manipulation can take place on the log management platforms side.
The easiest way to change the log format into a JSON format can be performed by directly updating the pattern through properties.
logging.pattern.console={"timestamp":"%d{yyyy-MM-dd'T'HH:mm:ss.SSSZ}","level":"%p","thread":"%t","logger":"%c","message":"%m"}%nAlternatively, you could use a third party Appender plugin that natively supports JSON logging format.
Add Dependency:
- Add the
logstash-logback-encoderdependency to your project's build configuration.
Create or Modify logback-spring.xml:
- In
src/main/resources, create a file namedlogback-spring.xml. This file allows Spring Boot to apply its own spring-specific configuration, such as profile-specific logging. - Example
logback-spring.xml:
<configuration>

    <appender name="CONSOLE" class="ch.qos.logback.core.ConsoleAppender">
        <encoder class="net.logstash.logback.encoder.LoggingEventCompositeJsonEncoder">
            <providers>
                <timestamp>
                    <timeZone>UTC</timeZone>
                </timestamp>
                <pattern>
                    <pattern>
                        {
                            "level": "%level",
                            "thread": "%thread",
                            "logger": "%logger",
                            "message": "%message",
                            "exception": "%exception"
                        }
                    </pattern>
                </pattern>
                <!-- Optionally include MDC properties -->
                <mdc/>
            </providers>
        </encoder>
    </appender>

    <root level="INFO">
        <appender-ref ref="CONSOLE"/>
    </root>
</configuration>
One advantage of this approach is that you do not need to explicitly define the names of MDC keys, it will automatically include any MDC key values as JSON fields.
For full configuration, refer to Logstash Logback Encoder documentation.
Summary
Today we explored how messy Java logging ecosystem can be; how Spring boot simplifies things, and how to fine-tune your logging configuration in Spring Boot when you need to.


