
Machine learning for anomaly detection: Elliptic Envelope
Bite-sized data science
Welcome back to anomaly detection; this is 6th in a series of “bite-sized” data science focusing on outlier detection. Today I am writing about a machine learning algorithm called EllipticEnvelope , which is yet another tool in data scientists’ toolbox for fraud/anomaly/outlier detection.
In case you have missed my previous articles or you are interested in learning more about the topic, find the links below:
Elliptical Envelope
So what is elliptic envelope and what’s the intuition behind the algorithm?
If you have taken geometry classes you are probably familiar with ellipse — a geometric configuration that takes an oval shape on a two-dimensional plane.

The green area in the above diagram is an ellipse. So the algorithm — Elliptical Envelope— creates an imaginary elliptical area around a given dataset. Values that fall inside the envelope are considered normal data and anything outside the envelope is returned as outliers. So, naturally, the red data points in the above diagram should be identified as outliers by this algorithm. As evident from this figure, the algorithm works best if data has a Gaussian distribution.
Implementation
sklearn is the Swiss army knife of machine learning algorithms. So not surprisingly it has a module for anomaly detection using the elliptical envelope as well. Below I am demonstrating an implementation using imaginary data points in 5 simple steps.
Step 1: Import libraries
# import libraries
import pandas as pd
import numpy as np
from sklearn.covariance import EllipticEnvelope
import matplotlib.pyplot as plt
Step 2: Get the training data
# create a dataframe
df = pd.DataFrame(np.array([[0,1], [1,1], [1,2], [2,2], [5,6]]), columns = ["x", "y"], index = [0,1,2,3,4])
# show data in a scatterplot
plt.scatter(df["x"], df["y"], color = "r")
plt.grid()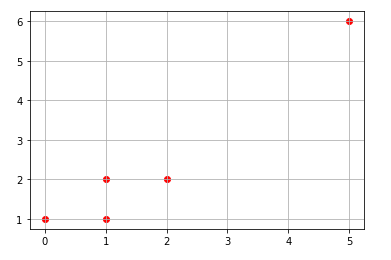
Step 3: Prepare inputs
# convert dataframe to arrays
data = df[['x', 'y']].values
Step 4: Modeling
The most important parameter in defining the model is to set the “contamination” parameter, which basically defines the proportion of values that will be identified as outliers. The parameter value ranges between 0 and 0.5
# instantiate model
model1 = EllipticEnvelope(contamination = 0.1)
# fit model
model1.fit(data)Step 5: Prediction
# new data for prediction (data needs to be in arrays)
new_data = np.array([[10,10], [1,1], [1,1], [1,1]])
# predict on new data
pred1 = model1.predict(new_data)
print(pred1)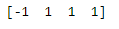
Summary and next steps
The purpose of this article was to introduce Elliptic Envelope — a machine learning algorithm for anomaly detection — and implementing the algorithm using the Scikit-Learn library. If you now have the key concepts clear, go ahead and try implementing it on a real dataset, for example, the Iris dataset available online. You should be able to use the same 5 steps above on this dataset, just need to make sure that you’ve selected the right columns for the algorithm to work.


