
Machine Learning Engineer — the new “sexiest” job in AI and Machine Learning domain?
Differences of SHAP values for reported 2022–2023 yearly compensations between Machine Learning Engineers and Data Scientists across

One of the results from my previous regularly updated paper,
is an important observation is that the Data Scientist job is no longer the one with the highest reported salaries (quantified in terms of SHAP values for reported yearly compensation):
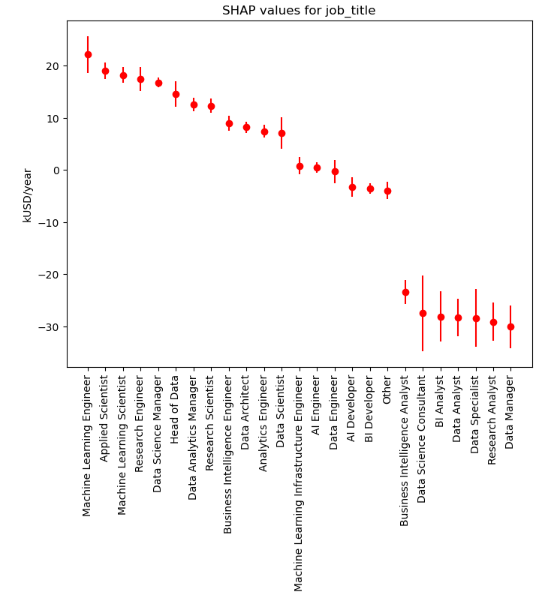
In other words, in terms of Machine Learning model trained to predict the reported salary based on various features (job title, experience level, country location, work year, company size, remote work ratio, and employment type), the average difference between the model predictions (given other parameters the same) for Machine Learning Engineers and Data Scientists is about 14,000 USD/year, or about 10% of the average yearly compensation.
Below, I further break the difference between these two job titles in terms of the abovementioned features. The corresponding code is available as a Kaggle notebook.
The code snippet in Python:
def plot_gap(col, main_col="job_title", value1="Machine Learning Engineer", value2="Data Scientist"):
    df_infl = X_test.copy()
    df_infl['shap_gd'] = shap_values[:,int(list(X_test.columns).index(main_col))]
    df1_mean = pd.pivot_table(df_infl, values=['shap_gd'], index=[col, main_col], aggfunc=np.mean)
    df1_std = pd.pivot_table(df_infl, values=['shap_gd'], index=[col, main_col], aggfunc=np.std)
    df2_mean = pd.pivot(df1_mean.reset_index(), index=col, columns=main_col, values='shap_gd')[[value1, value2]].dropna(axis=0)
    df2_mean['gap'] = df2_mean[value1]-df2_mean[value2]
    df2_std = pd.pivot(df1_std.reset_index(), index=col, columns=main_col, values='shap_gd')[[value1, value2]]
    df2_std['std'] = np.sqrt(df2_std[value1]**2 + df2_std[value2]**2)
    df2 = df2_mean[['gap']].join(df2_std[['std']], how='inner')
    df2 = df2.dropna(axis=0).sort_values('gap', ascending=False).sort_values('gap', ascending=False)
    plt.figure(figsize=(12,8))
    plt.bar(x=df2.index, height=df2['gap'])
    plt.errorbar(df2.index, df2['gap'], yerr=df2['std'], fmt="o", color="r")
    plt.title(f'SHAP value of gap per {col}, yearly compensation')
    plt.ylabel('kUSD/year')
    plt.tick_params(axis="x", rotation=90)
    plt.show();
    print()
    print()
    df_infl['shap_'] = shap_values[:,int(list(X_test.columns).index(col))]
    df2['avg_pay'] = expected_values + df_infl.groupby(col)['shap_'].mean()
    df2['avg_pp'] = 100*df2['gap']/df2['avg_pay']
    df2 = df2.sort_values('avg_pp', ascending=False)
    plt.figure(figsize=(12,8))
    plt.bar(x=df2.index, height=df2['avg_pp'])
    plt.errorbar(df2.index, df2['avg_pp'], yerr=100*df2['std']/df2['avg_pay'], fmt="o", color="r")
    plt.title(f'Gap per {col} relative to average pay')
    plt.ylabel('Percentage points')
    plt.tick_params(axis="x", rotation=90)
    plt.show();
    return

for col in X_test.columns:
    if col != 'job_title':
        print(col)
        plot_gap(col)
Work year
The difference between SHAP values for predicted Machine Learning Engineer and Data Scientist yearly compensations grows between 2022 and 2023, both in absolute terms:
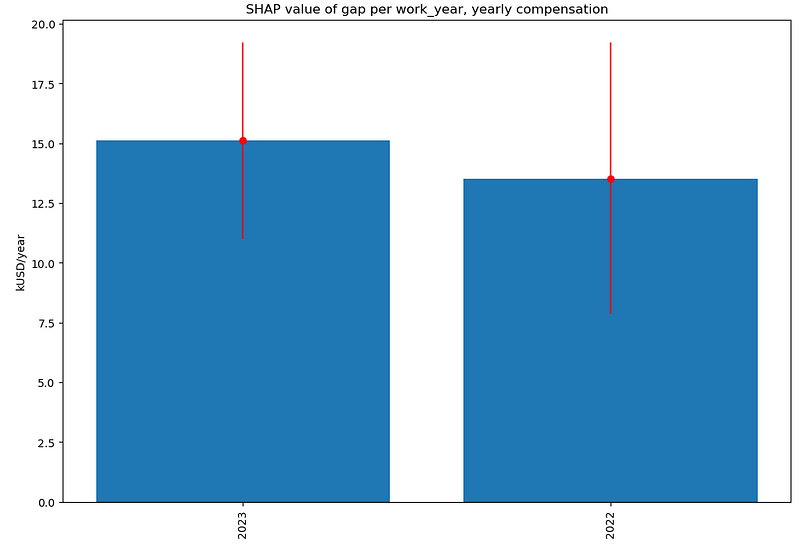
and in relative terms:
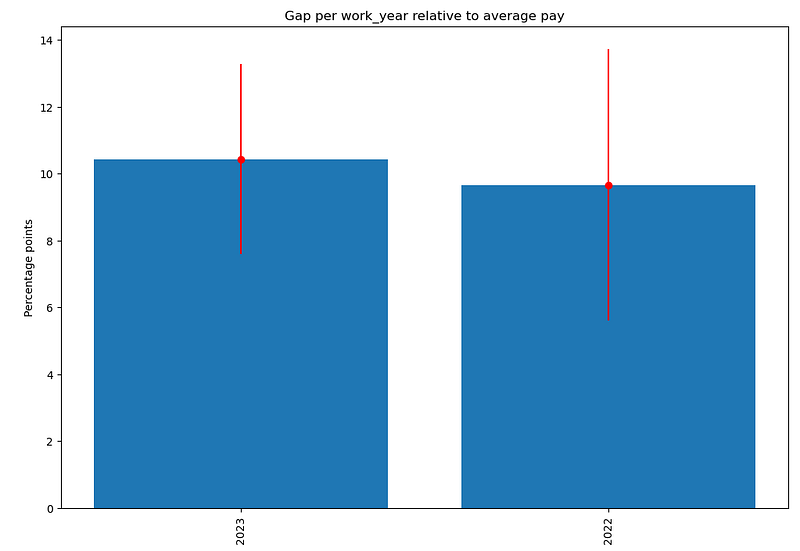
In other words, the gap between these job titles becomes larger over time.
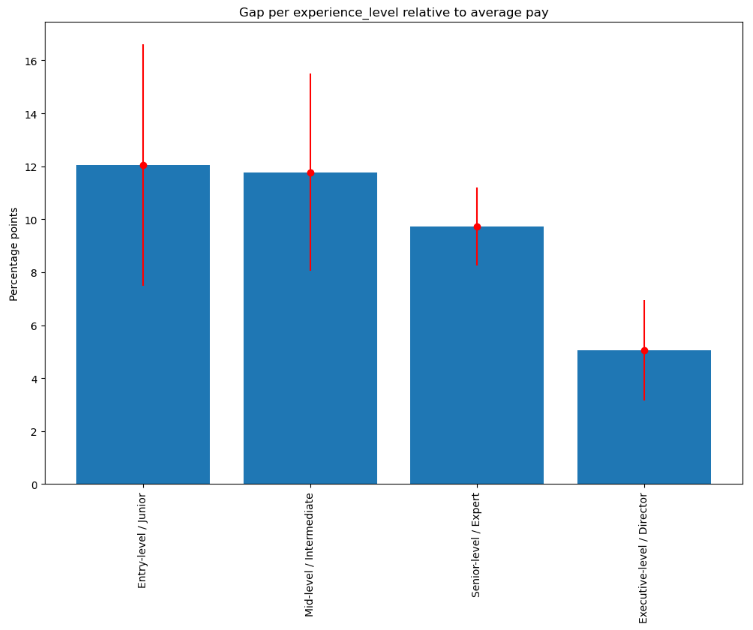
Experience level
While the largest absolute difference between SHAP values for predicted Machine Learning Engineer and Data Scientist yearly compensations is for Senior level (Expert) positions:
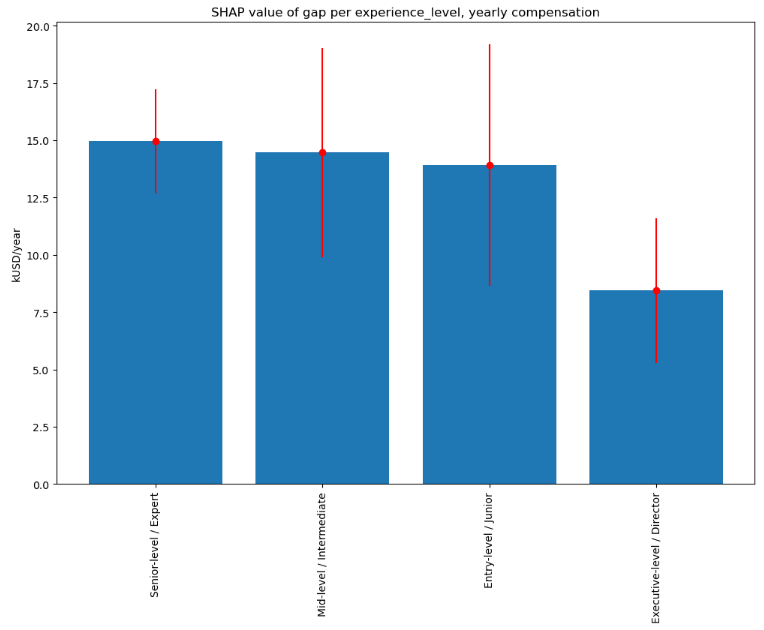
the largest relative difference (about 12%) is for Entry level (Junior) positions:
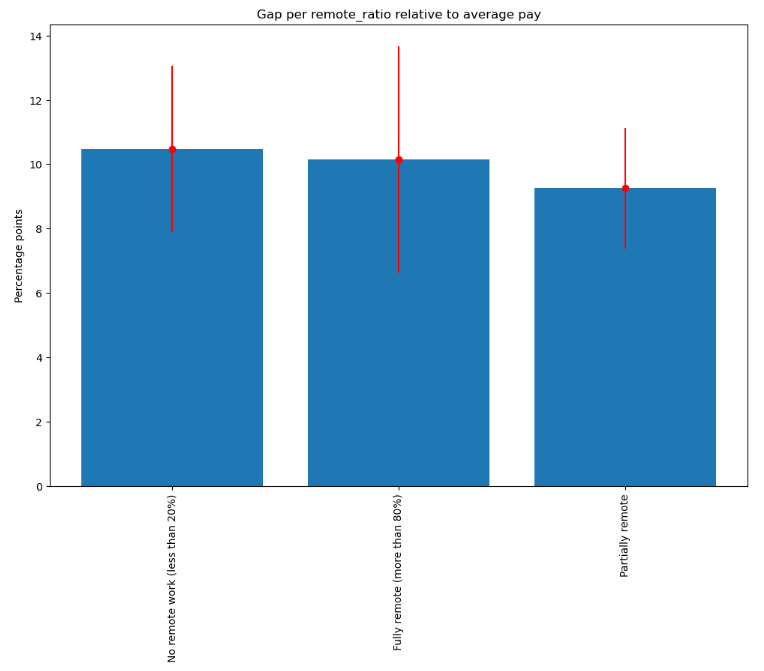
Remote work ratio
Both absolute gap and relative gap are the largest for the non-remote work:

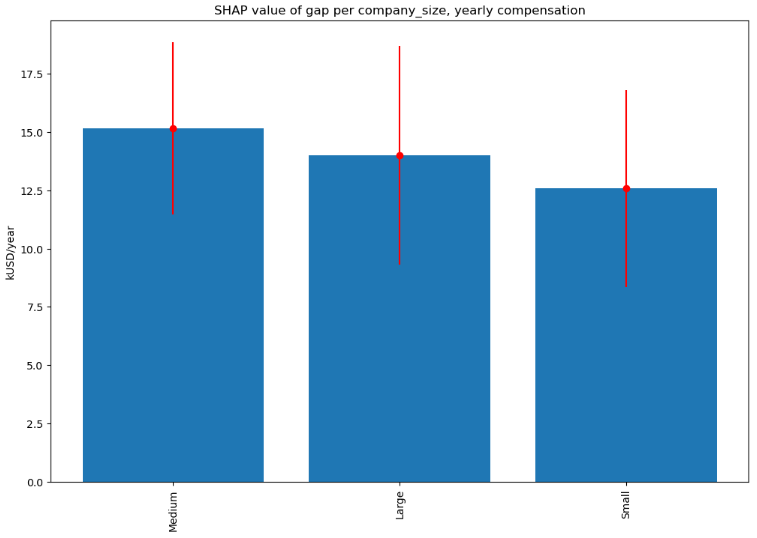
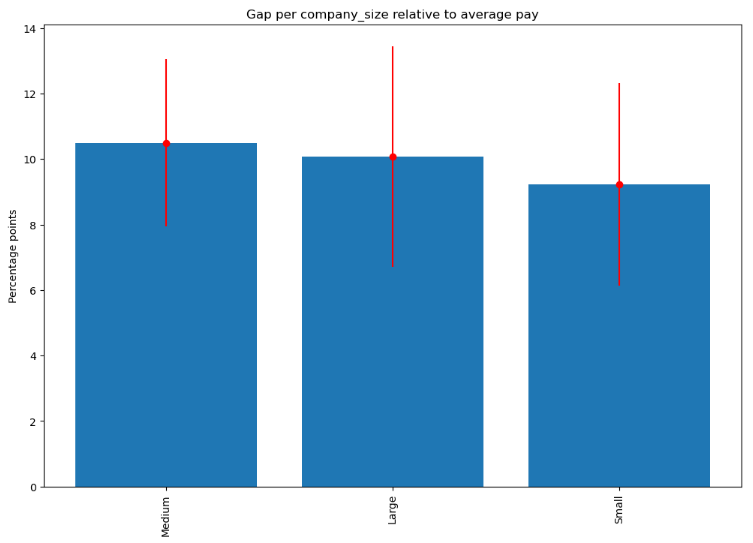
Company size
Both absolute gap and relative gap are the largest for the medium-sized companies (50 to 250 employees):
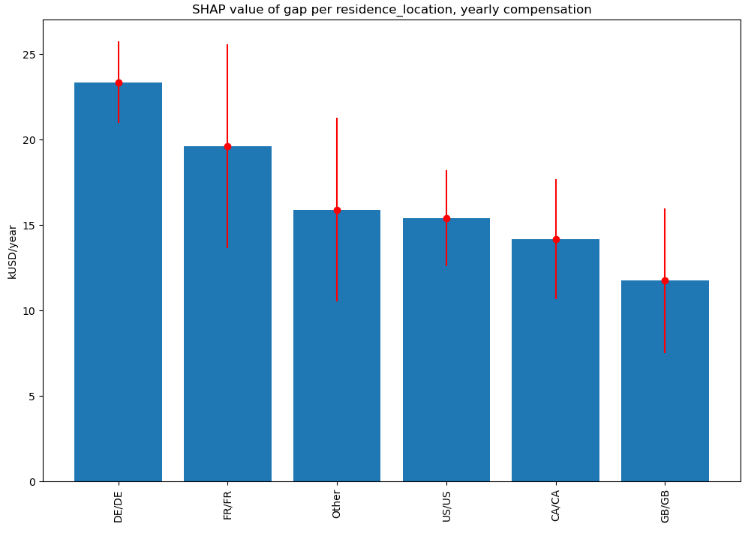
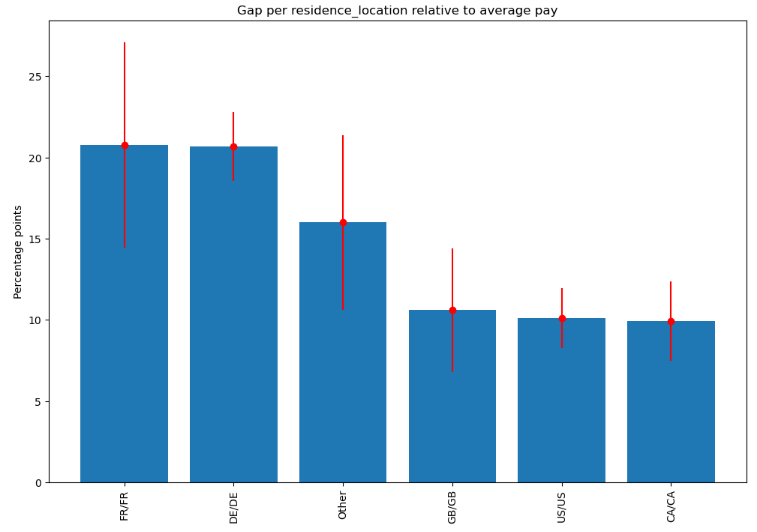
Residence location
Finally, the largest difference in absolute and relative (about 20%!) terms is for employees working and residing in leading EU markets such as Germany and France:
I hope these results can be useful for you. In case of questions/comments, do not hesitate to write in the comments below or reach me directly through LinkedIn or Twitter.


