
Machine Learning Algorithms(7)- Naive Bayes’ Algorithm and K-Nearest Neighbors Algorithm
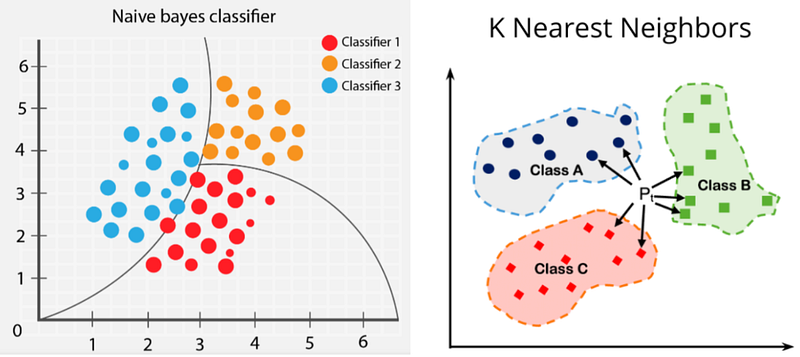
In this article, I am going to explain two Machine Learning algorithms called Bayes Theorem and K-Nearest Neighbors Algorithm. Bayes’ Theorem, named after 18th-century British mathematician Thomas Bayes, is a mathematical formula for determining conditional probability. The k-nearest neighbors algorithm, also known as KNN or k-NN, is a non-parametric, supervised learning classifier, which uses proximity to make classifications or predictions about the grouping of an individual data point.
Bayes Theorem
Example 1: I have an experiment rolling a dice.
What are the elements I have:
{1,2,3,4,5,6}

Probability if 1 coming when I roll a dice?
P(1) = 1/6
Probability if 2 coming when I roll a dice?
P(2) = 1/6
Probability if 3 coming when I roll a dice?
P(3) = 1/6
Probability if 4 coming when I roll a dice?
P(4) = 1/6
Probability if 5 coming when I roll a dice?
P(5) = 1/6
Probability if 6 coming when I roll a dice?
P(6) = 1/6
These events basically called Independent events. Because the probability of getting one element does not depend on the others.
Example 2: I have a box of Marbles.
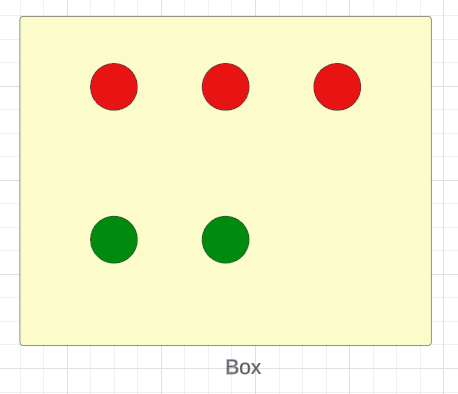
//Probability of taking out a red Marble and you remove it from the Box
P(R) = 3/5
//Now Probability of taking out a green Marble
P(R) = 2/4 =  1/2
These events are dependent events because the number of Marbles is reduced as you take them out from the box.
//Now what is the Probability of taking out a red Marble and then a green Marble
//We can denote it by
P(R) * P(G/R)     : This P(G/R) is called as conditional probability. This means Probability of Green when given Red

P(A and B) = P(A) * P(B/A)
Is P(A and B) equal to the P(B and A)? Yes
P(A and B) = P(A) * P(B/A)  -> 1
P(B and A) = P(B) * P(A/B)  -> 2

//Let's explain this using our Marble Box example,
R =  Red Marble   G = Green Marble
{R, R, R, G, G}
P(B and G) = P(R) * P(G/R) = 3/5 * 2/4 = 3/ 10
P(G and B) = P(G) * P(R/G) = 2/5 * 3/4 = 3/ 10

//Now you can see both are equal.
Then:
P(A and B) = P(B and A)
Now I can write this equation like,
P(A and B) = P(B) * P(A/B)

P(A) * P(B/A) = P(B) * P(A/B)

P(B/A) = P(B) * P(A/B) / P(A) : This is called as Bayes Theorem
How we are using the Bayes Theorem to solve problems?
Assume I have some features(Independent features) like x1, x2, x3, x4, and my output is Y(output feature) which are yes and no.
Now based on the input values I need to predict the output using Bayes Theorem.
//Probability of getting yes when given x1, x2, x3, x4 values can be shown as,

P(Y=yes/Given x1, x2, x3, x4) = P(Y=yes) * P(x1, x2, x3, x4 / Y=yes) / P(x1, x2, x3, x4…. xn)

//This can be wriiten like this,

P(Y=yes/x1, x2, x3, x4) = P(Y=yes) * P(x1/Y=yes) * P(x2/Y=yes) * P(x3/Y=yes) * P(x4/Y=yes) / P(x1) * P(x2) * P(x3) * P(x4)

//Probability of getting no when given x1, x2, x3, x4 values can be shown as,

P(Y=no/x1, x2, x3, x4) = P(Y=no) * P(x1/Y=no) * P(x2/Y=no) * P(x3/Y=no) * P(x4/Y=no) / P(x1) * P(x2) * P(x3) * P(x4)
Here you can see the denominator is fixed(For yes and no you are getting the same value for the denominator ). So that we can ignore the denominator. Let’s say P(Y=yes/x1, x2, x3, x4) = 0.15 and P(Y=no/x1, x2, x3, x4) = 0.05. In the binary classification any value ≥ 0.5 we can consider it as 1 and for ≤ 0.5 we can consider it as 0.
P(Y=yes/x1, x2, x3, x4) = 0.15
P(Y=no/x1, x2, x3, x4) = 0.05

// We do normalization to map this problem to Binary Classification. In the normalization we devide
the probability of actual value using sum of all the probabilities of actual values.

// After Nomalization :
P(Y=yes/x1, x2, x3, x4) = 0.15 / 0.15 + 0.05 = 0.15 / 0.20 = 0.75 which is > 0.5

P(Y=no/x1, x2, x3, x4) = 0.05 / 0.15 + 0.05 = 0.05 / 0.20 = 0.25 which is < 0.5
Let’s take a dataset and calculate the probability, This is about the probability of playing Golf when given 4 features Outlook, temperature, Humidity, and Windy conditions.
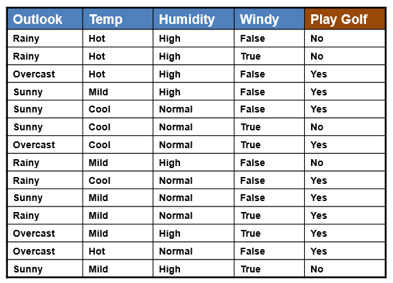
Against the Outlook feature, I can list down all the possibilities and predict whether we can play Golf or not.
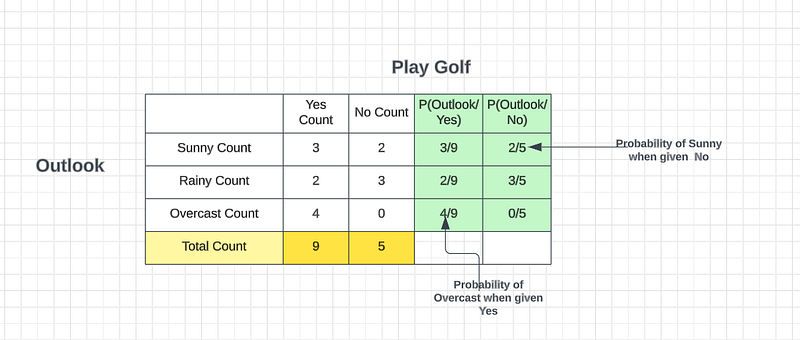
Probability of we can play Golf is = 9 / (9 + 5) = 9 /14
Probability of we cannot play Golf is = 5 / (9 + 5) = 5 /14
Against the Temperature feature, I can list down all the possibilities and predict whether we can play Golf or not.
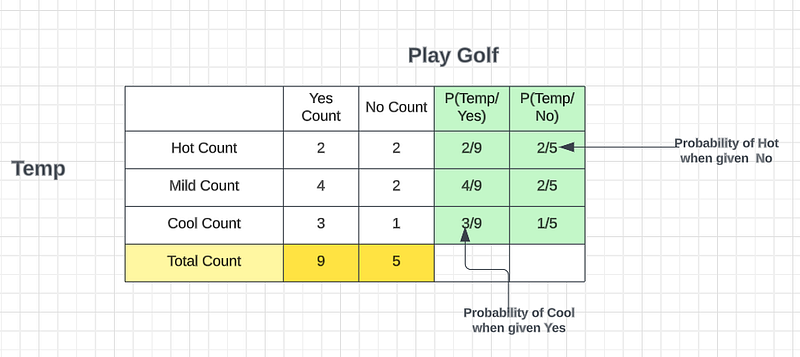
Probability of we can play Golf is = 9 / (9 + 5) = 9 /14
Probability of we cannot play Golf is = 5 / (9 + 5) = 5 /14
Let’s say you get new test data and you got Sunny and Hot as the data what is the output? Using Bayes Theorem we will try to find it.
P(Yes/ Given Sunny and Hot)?
P(Yes/ Given Sunny and Hot) = P(Yes) * P(Sunny / Yes) * P(Hot / Yes)
                               ---------------------------------------
                                            P(Sunny) * P(Hot)

Now you know that P(Sunny) * P(Hot) is a constant (For no also you will get the same value)

P(Yes/ Given Sunny and Hot) = P(Yes) * P(Sunny / Yes) * P(Hot / Yes)

P(Yes/ Given Sunny and Hot) = 9/14 * 3/9 * 2/9
                            = 6 / 14 * 9 = 2 / 24 = 1/ 21 = 0.0476


P(No/ Given Sunny and Hot) = P(No) * P(Sunny / No) * P(Hot / No)
                               ---------------------------------------
                                            P(Sunny) * P(Hot)


P(No/ Given Sunny and Hot) = P(No) * P(Sunny / No) * P(Hot / No)
                           = 5 /14 * 2/5 * 2/5 = 2 /35 = 0.057


P(Yes/ Given Sunny and Hot) = 0.0476
P(No/ Given Sunny and Hot)  = 0.057

Nomalize the values
---------------------
P(Yes/ Given Sunny and Hot) = 0.0476 / 0.0476 + 0.057 = 0.0476 / 0.1046 = 0.45
P(No/ Given Sunny and Hot)  = 0.057  / 0.0476 + 0.057 = 0.057 / 0.1046 = 0.545

So now you can see the posibility of No is > than 0.5 which is the Answer.
If the weather is Sunny and Hot what will the person do -> He should not play Golf
Let’s say you get new test data and you got Rainy and Cool as the data what is the output? Using Bayes Theorem we will try to find it.
P(Yes/ Given Rainy and Cool)?
P(Yes/ Given Rainy and Cool) = P(Yes) * P(Rainy/ Yes) * P(Cool/ Yes)
                               ---------------------------------------
                                            P(Rainy) * P(Cool)

Now you know that P(Rainy) * P(Cool) is a constant (For probability no also you will get the same value)

P(Yes/ Given Rainy and Cool) = P(Yes) * P(Rainy / Yes) * P(Cool/ Yes)

P(Yes/ Given Rainy and Cool) = 9/14 * 2/9 * 3/9
                            = 1/21 = 0.048

P(No/ Given Rainy and Cool) = P(No) * P(Sunny / No) * P(Hot / No)
                               ---------------------------------------
                                            P(Sunny) * P(Hot)

P(No/ Given Rainy and Cool) = P(No) * P(Sunny / No) * P(Hot / No)
                           = 5 /14 * 3/5 * 1/5 = 3/70 = 0.043

P(Yes/ Given Rainy and Cool) = 0.048
P(No/ Given Rainy and Cool)  = 0.043

Nomalize the values
---------------------
P(Yes/ Given Rainy and Cool) = 0.048 / 0.048 + 0.043 = 0.048 / 0.091 = 0.53
P(No/ Given Rainy and Cool)  = 0.043  / 0.048 + 0.043 = 0.043 / 0.091 = 0.47

So now you can see the posibility of Yes is > than 0.5 which is the Answer.
If the weather is Rainy and Cool what will the person do -> He can play Golf
Let’s say you get new test data and you got Overcast and Mild as the data what is the output? Using Bayes Theorem we will try to find it.
P(Yes/ Given Overcast and Mild)?
P(Yes/ Overcast and Mild) = P(Yes) * P(Overcast / Yes) * P(Mild / Yes)
                               ---------------------------------------
                                            P(Overcast) * P(Mild)


Now you know that P(Overcast) * P(Mild) is a constant (For no also you will get the same value)

P(Yes/ Overcast and Mild) = P(Yes) * P(Overcast / Yes) * P(Mild / Yes)
P(Yes/ Overcast and Mild) = 9/14 * 4/9 * 4/9
                            = 8/63 = 0.127


P(No/ Given Overcast and Mild) = P(No) * P(Overcast/ No) * P(Mild / No)
                           = 5 /14 * 0/5 * 2/5 = 0


P(Yes/ Given Overcast and Mild) = 0.127
P(No/ Given Overcast and Mild)  = 0

Nomalize the values
---------------------
P(Yes/ Given Overcast and Mild) = 0.127 / 0.127 + 0 = 0.127 / 0.127 = 1
P(No/ Given Overcast and Mild)  = 0  / 0.127 = 0

So now you can see the posibility of Yes is > than 0.5 which is the Answer.
If the weather is Overcast and Mild  what will the person do -> He can play Golf
Bayes Theorem Real-time Applications
One of the many applications of Bayes’ theorem is Bayesian inference, a particular approach to statistical inference. Bayesian inference has found application in various activities, including medicine, science, philosophy, engineering, sports, law, etc. For example, we can use Bayes’ theorem to define the accuracy of medical test results by considering how likely any given person is to have a disease and the test’s overall accuracy. Bayes’ theorem relies on consolidating prior probability distributions to generate posterior probabilities. In Bayesian statistical inference, prior probability is the probability of an event before new data is collected.
Try to find the answer to these questions using Bayes Theorem. Use the comment section to give answers or to ask questions.
- Three persons A, B and C have applied for a job in a private company. The chance of their selections is in the ratio 1: 2: 4. The probabilities that A, B, and C can introduce changes to improve the profits of the company are 0.8, 0.5, and 0.3, respectively. If the change does not take place, find the probability that it is due to the appointment of C.
- A bag contains 4 balls. Two balls are drawn at random without replacement and are found to be blue. What is the probability that all balls in the bag are blue?
- In a neighborhood, 90% of children were falling sick due to flu and 10% due to measles and no other disease. The probability of observing rashes for measles is 0.95 and for flu is 0.08. If a child develops rashes, find the child’s probability of having flu.
- In shop A, 30 tin pure ghee and 40 tin adulterated ghee are kept for sale while in shop B, 50 tin pure ghee and 60 tin adulterated ghee are there. One tin of ghee is purchased from one of the shops randomly and it is found to be adulterated. Find the probability that it is purchased from shop B.
- A card is lost from a pack of 52 cards. From the remaining cards, two are drawn randomly and found to be both clubs. Find the probability that the lost card is also a club.
- A sack contains 4 balls. Two balls are drawn at random (without replacement) and are found to be red. What is the probability that all balls in the bag are red?
K-Nearest Neighbors Algorithm(KNN)
KNN Algorithm is a simple yet efficient solution to both classification and regression problems. Let’s begin by discussing the first classification problem. Assume that we have a binary classification problem with two sets of data points. Now, suppose we introduce a new data point. How can we determine whether it belongs to one of the two categories? If we use logistic regression, we may divide these data points by a line, but this scenario requires a different approach. This is where the K Nearest Neighbor comes into play.
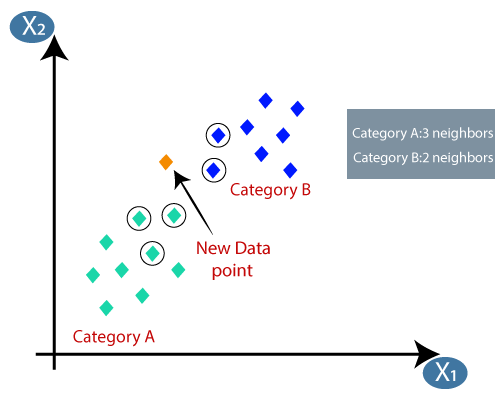
K-nearest neighbor is a simple algorithm that works by taking the five closest points to us(Here the K value is 5. K is a hypo parameter), which represents our nearest point. In this scenario, we can see that the maximum number of points are from the green category(Category A), with only three points. We categorize our new data points to the maximum number of points that belong to the K value. To achieve this, we use two specific distances,
- Euclidean distance
- Manhattan distance
To calculate the Euclidean distance between two points, denoted by
d = √[ (x2– x1)^2 + (y2– y1)^2].On the other hand, for the Manhattan distance, we calculate the distance between the two points.
d = |x1 - x2| + |y1 - y2|The difference between these two distances is that we do not calculate the hypothetical distance.
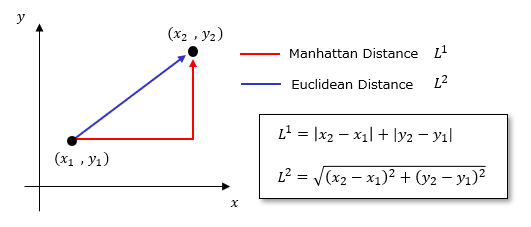
These methods are used for classification problems. For regression, we use a different approach.
For regression, Let’s take the K value as 3. We take the nearest 3 points to calculate a new data point. K, which is a hyperparameter, represents the number of nearest points. If we need to calculate an output for a new data point, we find the nearest K points and then calculate their average to obtain the output value.
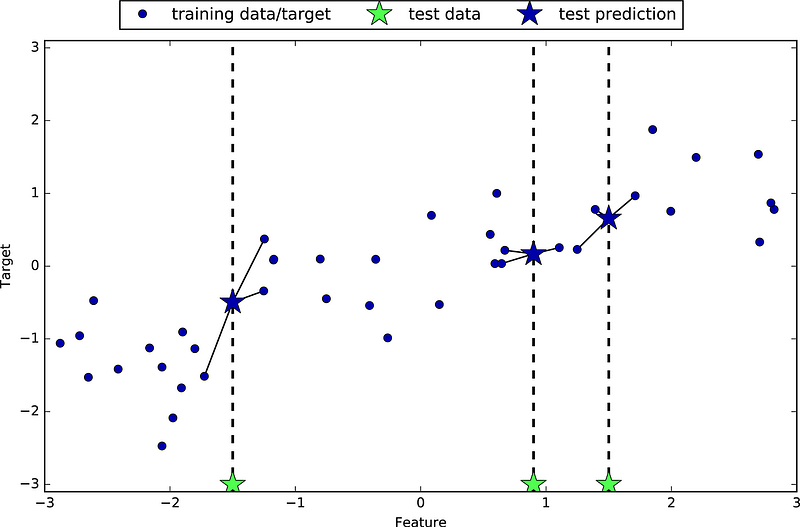
We calculate values for K is equal to 1 to 50, and then we probably try to check the error rate, and if the error rate is less than only, we select the model.
Two more things concerning K’s nearest neighbor work very badly
- Outliers
- Imbalanced data set
So the limitation of KNN is that due to the presence of an Imbalanced or Outlier dataset, it might misclassify the points.
Outlier
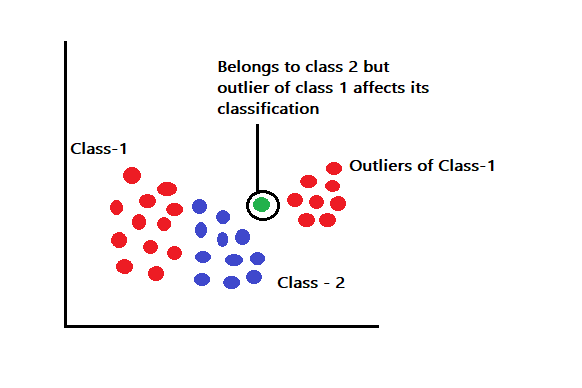
Consider the above image having outliers belonging to class -1. Assume that we want to predict a point in between the class-1 labeled outliers and class-2 labeled training points. The test point might belong to the class-2 label but due to the presence of a class-1 outlier, the points might just be misclassified wrongly in class-1.
Imbalance
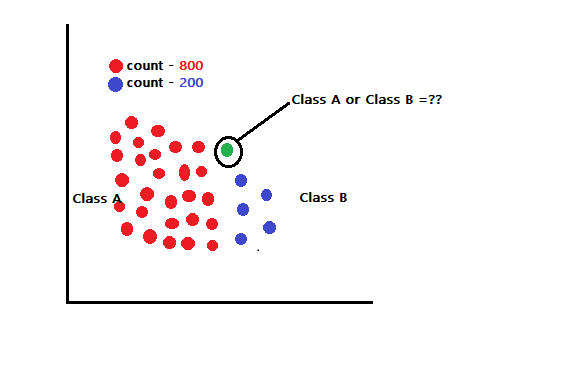
Consider a case in a sample space where there are around 1000 points either classified as class A or class B. Assume that out of 1000 points, 800 points belong to class A which indicates that the dataset is highly imbalanced. Can this impact the classification of new test samples? Yes, Consider that we want to find the class label of point X in the sample space. If we consider the k value to be very large say around 150 then the imbalanced dataset will push point X to fall into class A forcefully which might result in misclassification.
How to choose the best value of K?
The best value of k is the one that offers minimum errors and maximum accuracy. We focus on taking a random set of values for k and validate which of the values of k we obtain the minimum error rate while training and testing the model.
So this is all about the Naive Bayes Algorithm and K-Nearest Neighbors Algorithm. I hope you get a good understanding of these 2 theories.
See you in another tutorial.
Thank You!