
Machine Learning Algorithm From Scratch
Step-by-step guide on the linear regression algorithm

Learning linear regression is a good way to kick start your Machine Learning or Data Science career. The algorithm is one of the simplest.
I addressed the basic concepts and a bit of history in this article, and now I’ll go deeper by covering the algorithm’s details. The code in Python I present in this post is from one of the Pragmatic Programmers chapters available on Medium.
Before jumping to the technical details, let’s recap the concept.
Linear regression is a modelling approach used in machine learning to assess the correlation between one dependent variable and more independent ones. Here are a few examples:
- Years of work experience and salary — If you want to predict a person’s salary from their experience, then “Salary” is the dependent variable y (the vertical/y-axis in a graph) and “Experience” is the independent x variable (the horizontal/x-axis in a graph). It’s possible to use other independent variables (also known as explanatory variables), such as “Education” (e.g. bachelor’s, master’s, PhD).
- Person’s height and shoe size — Choose the variable you want to predict and apply the same logic as above.
It can answer questions such as why did the value y vary? Why, on a particular day, was it above the average? The goal is to predict (only an estimate) a value y (e.g. salary) based on other attributes x (e.g. years of experience).
Imagine the following use case.
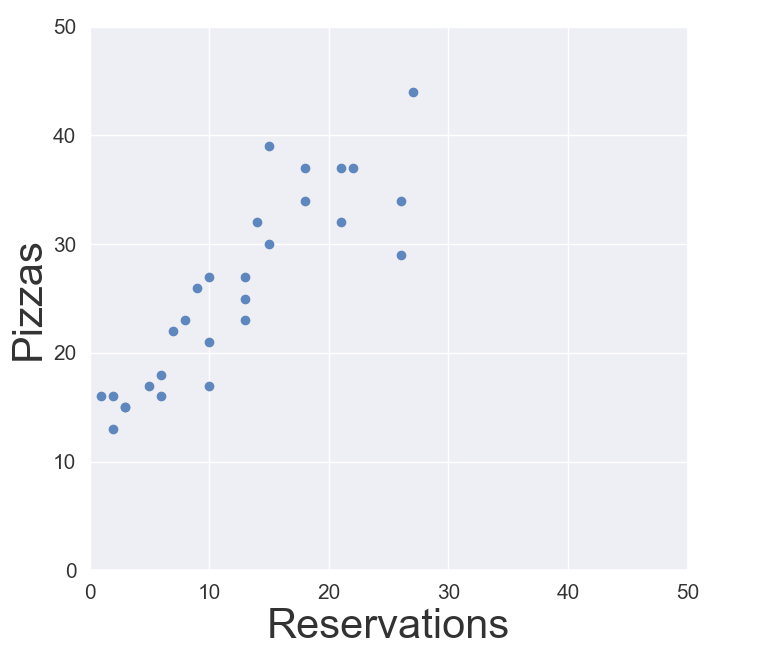
The goal is to predict the number of pizzas sold based on how many reservations are booked for the day. This is done by analysing the current data. You collect the number of pizzas consumed and reservations and plot them in a graph. That’s your model.
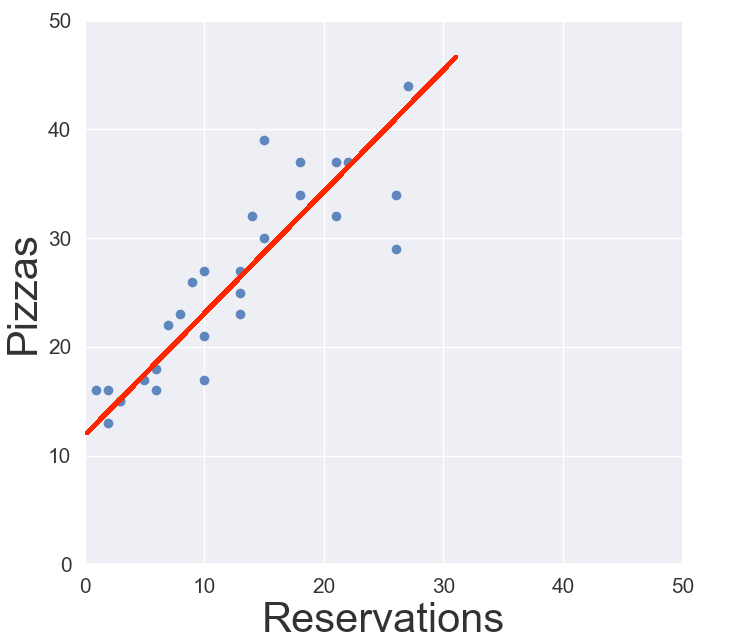
The next step is to find a line that crosses the graph with the least distance to all data points.
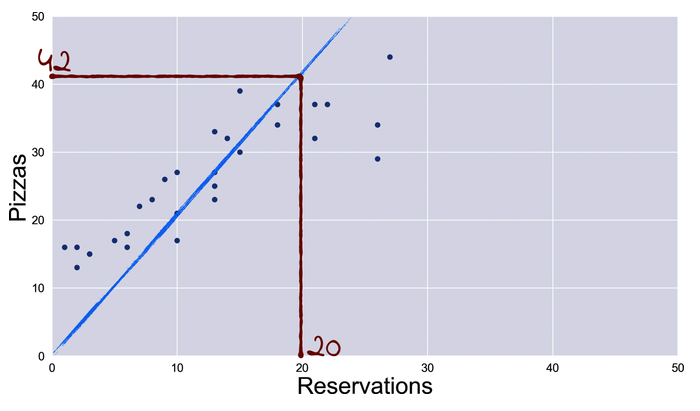
Once you find the line, you can predict the value in Y (pizzas to be sold). For example, if there are 20 reservations, you draw a line starting at a point represented by 20 in X and go all the way up until it meets the regression line. Then you find the data point in Y that is in the same direction as the regression line — Here’s a visual taken from one of the Pragmatic Programmers chapters.
But how to find the line? As I explained in my other article, a series of calculations will get you to it.
But a more intuitive perspective is to try multiple lines in different directions, and each time, for each line, you predict Y and compare with the existing Y value already collected — the ground truth.
By how much is the prediction wrong compared to the existing data? The line that results in fewer prediction errors is the correct one.
That’s what the algorithm does, and below is the code in full. Let’s explore it in detail.
The algorithm is composed of four parts.
- Training
- Prediction
- Calculating loss (between prediction and existing data)
- Plotting
Prediction and calculating loss is part of the training function. The output is of the training function is the regression line.
To predict the number of pizzas sold, the line must be represented mathematically by some value. That’s the slope and bias.
Once the algorithm finds the value of the slope (‘w’) and the bias (‘b’), it can predict with the formula ŷ=X * w + b. I’m going to explain the bias in a moment.
Another nuance to note is the ^ on top of the letter y (y-hat). It differentiates from the Y. The Y corresponds to the data already extracted, and the ŷ is the predicted value.
The loss function calculates the difference between the predicted value and the actual one.
The train function is where everything happens. It starts with w=0 (line with no slope) and increments or decrements based on the prediction error being greater or lesser than the previously calculated one (current_loss).
What about the bias I mentioned I was going to explain?! You might ask.
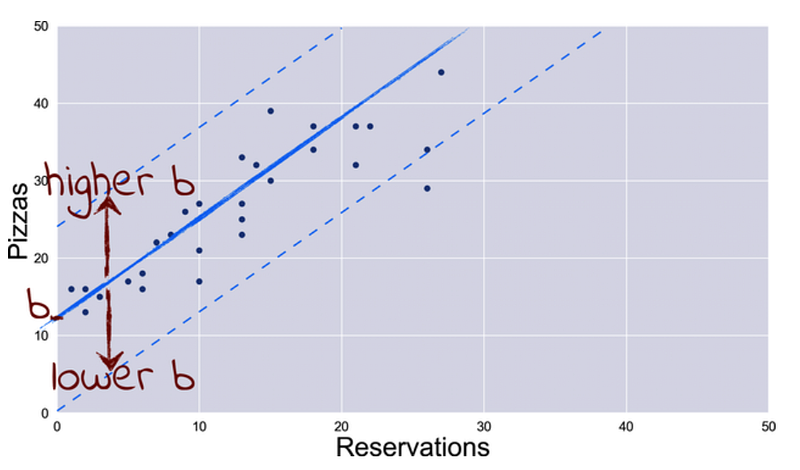
The ‘bias’ is the missing piece of calculating a more accurate line. It’s actually more commonly called the ‘y-intercept’. Did it make more sense to you with that name?
That’s right. The y-intercept is where the line crosses in the Y-axis. If there is no y-intercept, the line will always start from where the Y and X-axis meet each other, and that’s not ideal. Depending on where the data points are, it’s also important to know where the line moves up or down in the Y-axis.
Again, the prediction formula is:
ŷ = X * w + bFinal Thoughts
Based on the existing data points, some libraries give the best line fit (another name for the regression line). You often don’t need the algorithm presented in this post. But it’s helpful to see how it works from scratch. It helps understand the concept better.
I’m slowly building my knowledge in the Machine Learning field, and I hope I helped you too with this article. Stay tuned for more to come. Thanks for reading.