

BULLISH BITCOIN
Long-term prospects for Bitcoin look bullish
Although BTC gains have begun to slow down recently, long-term signals point to a more sustained recovery
Although Bitcoin and the associated cryptos are showing signs of slowing bullish momentum in the short term, other signals are pointing to a more sustained push in the long term. Even in the short term, news of MicroStrategy buying $177M worth of BTC, along with Coinbase planning to scoop up $500M of BTC is being seen positively by the market. And while a correction is entirely plausible from the current levels, the long-term path looks constructive.
At the time of writing, Bitcoin is trading close to $47.4k after retreating from the psychological barrier of $50k — last seen on May 12. Ethereum, similarly, almost touched $3,400 (last touch on May 16) and is now hovering around $3,120. Cardano (ADA), however, has been the success story of August — overtaking its previous high ($2.46) of May 16 to chart a new ATH of $2.96. The Alt. coin is now trading around $2.59.
According to the recent Chainalysis Market Intel, prospects look good for Bitcoin to sustain a long-term bullish trend. Despite a waning momentum in the short-term gains, the report highlight three factors that point to a healthy outlook for the premier digital coin, in the long run. Let’s get started then.
Re-Entry of Large Investors
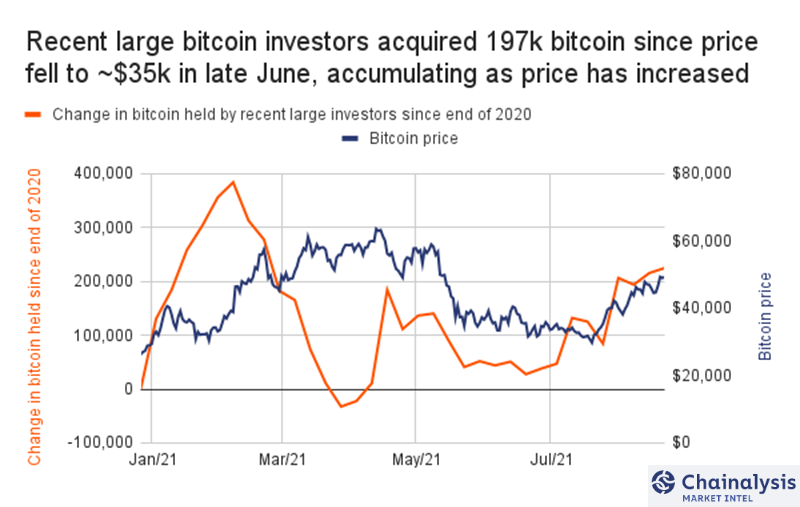
No surprise that large investors not only play a major role in moving the legacy financial markets but also play a key role in moving the pioneer crypto. As highlighted in my previous blog, 83% of the bitcoin into exchanges is from other exchanges and large traders. Although the overall market liquidity of BTC remains the same when such flows take place. However, when these large investors position themselves to accumulate the digital asset, the supply decreases significantly — causing a decline in liquidity & an increase in price.
This relationship didn’t hold as strongly as expected during March and April of this year, as recent large investors reduced their holdings but prices kept rising. The reason could be that these whales just moved their BTC to other wallets rather than selling them off completely.
The first chart (Figure 1) looks at the accumulation of bitcoin by recent, large investors — acquiring 197k bitcoin since the bitcoin price fell below $35k in late June. This led to the level last seen in late February when this group sold bitcoin as the price rocketed above $55k. These recent, large investors are self-hosted wallets that have held bitcoin for less than a year, have held at least 1k bitcoin in their lifetime, and on average retain at least 75% of the bitcoin they receive.
Increase in Fiat Buying
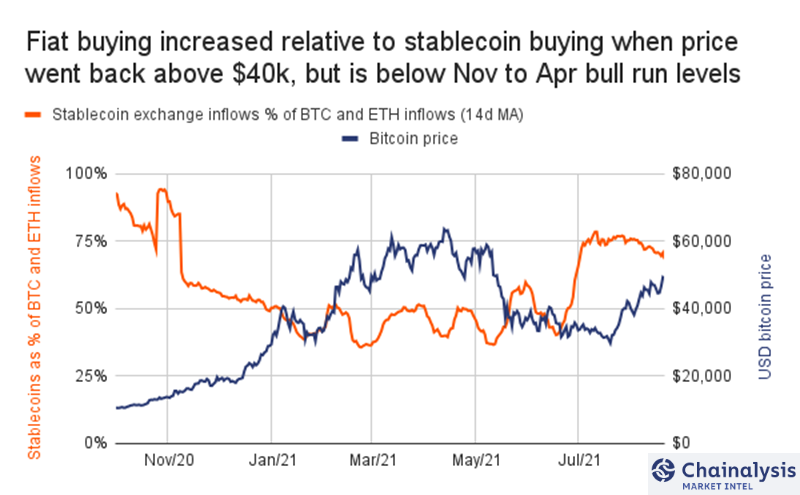
The second chart (Figure 2) looks at another interesting metric — stable coin exchange inflows as a percentage of bitcoin and Ethereum exchange inflows. Let’s first understand that Bitcoin and Ether are typically sent to exchanges to be sold, while stable coins are sent to exchanges to buy other assets, such as bitcoin and Ether. As an example, if $100 of bitcoin and Ether and $75 of stablecoins are sent into an exchange, then stable coin inflows are 75% of bitcoin and Ethereum inflows. We can then assume that 75% of the bitcoin and Ether sold is being bought with stable coins, and the remaining 25% bought with fiat.
Considering Stablecoins are typically used to buy at least a majority of bitcoin and Ethereum, what explains the drop in percentage of stablecoin inflows from 75% to less than 50% — despite the price of Bitcoin continued to rise from late 2020, well into 2021? This suggests the bull run was largely driven by fiat purchases, and that when fiat demand declined so did the price. Stablecoin buying jumped back to 75% in July — lately, the share has again started to decline again, as the price went back above $40k, and has continued to decline as the price has continued to climb. This suggests that fiat demand has returned and is driving the price.
Bitcoin Trade Intensity
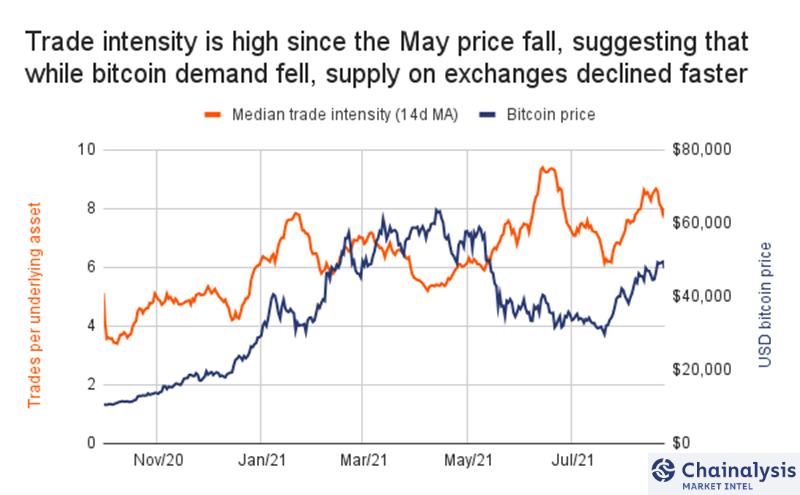
And the final signal is of trade intensity (Figure 3). This metric measures the trading volume per asset received on-chain by exchanges — representing how many times an underlying asset changes hands on an exchange. According to the analysis, trade intensity is currently high and has been high since the May price fall. Although while demand fell when prices dropped, supply declined even more. That means that investors stopped buying when the price dropped below $50k, they also stopped selling in anticipation of finding a price floor.
Looking at the chart, it is evident that the trade intensity has fallen recently, accompanied by a smaller price decline as well. This, however, doesn’t necessarily mean that price will continue to fall. And that is because the short-term indicator of trade intensity is outweighed by longer-term signals, such as accumulation by recent, large investors and increases in fiat buying.
Please keep in mind this is not any sort of investment advice & shouldn’t be treated as such. Always conduct your own due diligence and invest/trade according to your risk profile.
