
Long-Run Relationships between FANG Stocks
Interpreting VECMs
In a previous article, I created a model to predict the closing share prices of FANG stocks using a vector error correction model (VECM), which models cointegrated time series. I touched on some topics I wanted to expand on, namely interpreting the loading coefficients and long-run relationship coefficients, weak exogeneity, and impulse response functions.
Recall the general formulation of the VECM I estimated. The magic bit is the column vector of alphas and the row vector of betas. They make up the error-correction part of the model and make it a VECM and not a Vector Auto-regression model.
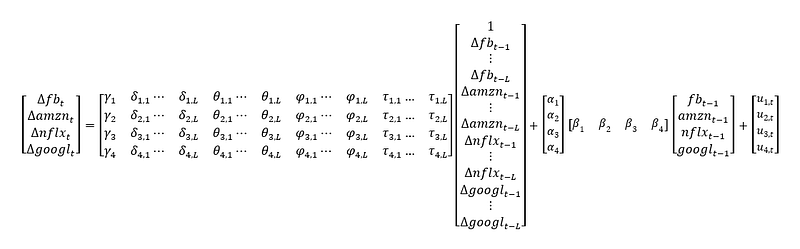
I redid my analysis in python and my new data only went back 5 years, so these results are slightly different than if I had used the data set going back to Facebook’s IPO.
The coefficients for the alphas, or loading coefficients, are below along with their z-scores and associated statistics.
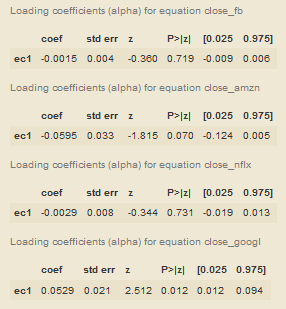
The loading coefficients (alphas) are the speed of adjustment to the long-run relationship. They are the percentage of disequilibrium from the long-run equilibrium that dissipates in one period. The alphas for the closing price of FB and NFLX are not statistically significant. The significance of the alpha for AMZN is ambiguous as it is significant at the 0.10 significance level, but not the 0.05 significance level. The alpha for GOOGL is statistically significant at the 0.05 significance level and estimated at 0.0529.
This information means FB and NFLX (and possibly AMZN) are weakly exogenous to GOOGL (and possibly AMZN). Weak exogeneity is the concept that deviations from the long-run do not directly affect the weakly exogenous variable. The effect comes from the subsequent lags from the non-weakly exogenous variables. The lags of GOOGL (and possibly AMZN) are the drivers of the return to the long-run equilibrium in the weakly exogenous variables.

The beta coefficients are the actual long-run relationship coefficients. The beta for FB is standardized at 1 for ease of interpretation of the other beta coefficients. The beta for GOOGL is -0.4204, which means a 1 dollar increase in GOOGL, leads to a 0.4204 dollar decrease in the closing price of FB in the long-run and 5.29% of this correction occurs within a day (from our associated alpha). Rearranging which beta is standardized is how you reformulate the equation to interpret the long-run relationship between the stock with the standardized beta and the others.
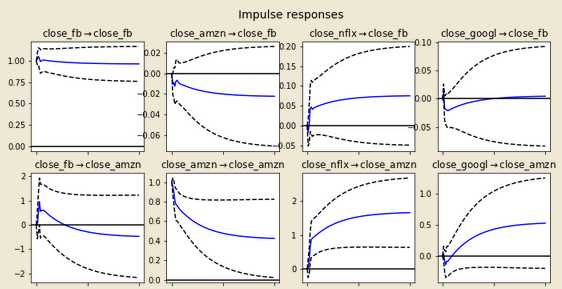
Finally, we can move on to the Impulse Response Functions (IRFs).
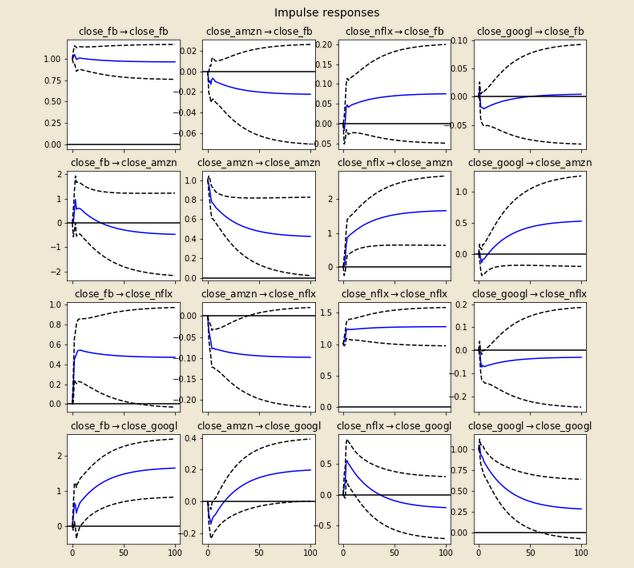
Impulse Response Functions (IRF) show what happens to one variable when you shock another (or the same variable) with an increase of 1 in the previous period. The blue curve shows the effect of the unit shock as the shock becomes less and less recent. The dotted lines represent the 95% confidence interval for the IRF.
A $1 shock to the closing price of GOOGL leads to a drop in the closing price of FB by about $0.02, but the effect of that shock goes to zero over time. The effect of a 1 dollar shock to NFLX initially increases GOOGL’s closing price by about $0.05, but then goes to approximately zero. A unit shock to FB however, persists as do some others like NFLX on AMZN. If all the IRFs were like those, the system would be dynamically unstable, but luckily 0 is within the 95% confidence level of many of our IRFs and our system is dynamically stable.
So now, you should have a decent introduction to modeling cointegrated time series. My next articles will focus on other problems and other statistical methods that can help solve them.
My code for this article can be found here: https://github.com/jkclem/FANG-stock-prediction