Logistic regression in Statistics and Machine learning
Logistic Regression is a statistical approach which is used for the classification problems. In statistics, the logistic model (or logit model) is used to model the probability of a certain class or event existing such as pass/fail, win/lose, alive/dead or healthy/sick. This can be combined to model several classes of events such as determining whether an image contains a cat, dog, lion, etc… Each object is detected in the image would be assigned a probability between 0 and 1 and the sum adding to one.
Types of logistic regression:
- Binary (eg. Tumor Malignant or Benign)
- Multi-linear functions fails Class (eg. Cats, dogs or Sheep’s)
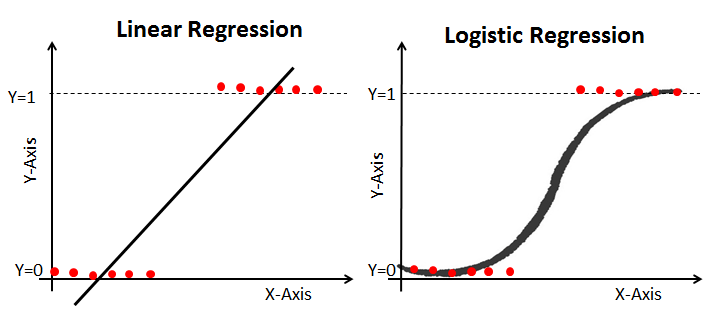
We can call a Logistic Regression a Linear Regression model but the Logistic Regression uses a more complex cost function, this cost function can be defined as the ‘Sigmoid function’ or also known as the ‘logistic function’ instead of a linear function. The hypothesis of logistic regression tends it to limit the cost function between 0 and 1. Therefore linear functions fail to represent it as it can have a value greater than 1 or less than 0 which is not possible as per the hypothesis of logistic regression.
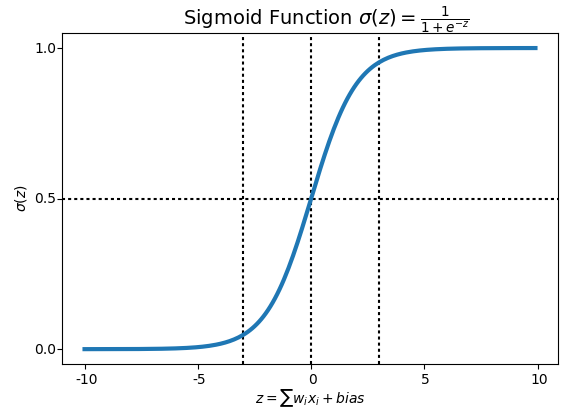
Sigmoid Function?
In order to map predicted values to probabilities, we use the Sigmoid function. The function maps any real value into another value between 0 and 1. In machine learning, we use sigmoid to map predictions to probabilities.
Performance of the Logistic Regression Model:
To evaluate the performance of a logistic regression model, we must consider a few points. Irrespective of tool (SAS, R, Python) you would work on, always look for:
1. AIC (Akaike Information Criteria) — The analogous metric of adjusted R² in logistic regression is AIC. AIC is the measure of fit which penalizes model for the number of model coefficients. Therefore, we always prefer the model with minimum AIC value.
2. Null Deviance and Residual Deviance — Null Deviance indicates the response predicted by a model with nothing but an intercept. Lower the value, better the model. Residual deviance indicates the response predicted by a model on adding independent variables. Lower the value, better the model.
3. Confusion Matrix: It is nothing but a tabular representation of Actual vs Predicted values. This helps us to find the accuracy of the model and avoid overfitting. This is how it looks like:
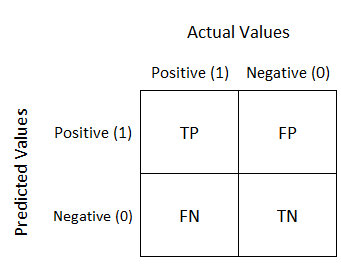
- true positives (TP): for correctly predicted event values.
- true negatives (TN): for correctly predicted no-event values.
- false positives (FP): for incorrectly predicted event values. (Also known as a “Type I error.”).
- false negatives (FN): for incorrectly predicted no-event values, (Also known as a “Type II error.”).
- Accuracy: Overall, how often is the classifier correct? Accuracy = (TP+TN)/total
- Recall: TP/TP+FN
- Misclassification Rate: Overall, how often is it wrong? Misclassification Rate=(FP+FN)/total
- “Error Rate” = 1 -Accuracy
- “Specificity” = 1 -False Positive Rate
- Precision: When it predicts yes, how often is it correct?Precision=TP/TP+FP
- Prevalence: How often does the yes condition actually occur in our sample? Prevalence=actual yes/total
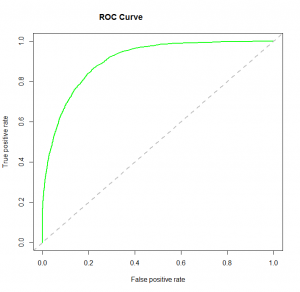
4. ROC Curve: Receiver Operating Characteristic(ROC) summarizes the model’s performance by evaluating the trade offs between true positive rate (sensitivity) and false positive rate(1- specificity). For plotting ROC, it is advisable to assume p > 0.5 since we are more concerned about success rate. ROC summarizes the predictive power for all possible values of p > 0.5. The area under curve (AUC), referred to as index of accuracy(A) or concordance index, is a perfect performance metric for ROC curve. Higher the area under curve, better the prediction power of the model. Below is a sample ROC curve. The ROC of a perfect predictive model has TP equals 1 and FP equals 0. This curve will touch the top left corner of the graph.
Note: For model performance, you can also consider likelihood function. It is called so because it selects the coefficient values which maximizes the likelihood of explaining the observed data. It indicates the goodness of fit as its value approaches one, and a poor fit of the data as its value approaches zero.
- Cohen’s Kappa: This is essentially a measure of how well the classifier performed as compared to how well it would have performed simply by chance. In other words, a model will have a high Kappa score if there is a big difference between the accuracy and the null error rate.
- F Score: This is a weighted average of the true positive rate (recall) and precision.
Advantages of Logistic Regression:
It is a widely used technique because it is very efficient, does not require too many computational resources, it’s highly interpretable, it doesn’t require input features to be scaled, it doesn’t require any tuning, it’s easy to regularize, and it outputs well-calibrated predicted probabilities.
Logistic regression does work better when you remove attributes that are unrelated to the output variable as well as attributes that are very similar (correlated) to each other. Therefore Feature Engineering plays an important role in regards to the performance of Logistic and also Linear Regression.
Because of its simplicity and the fact that it can be implemented relatively easy and quick, Logistic Regression is also a good baseline that you can use to measure the performance of other more complex Algorithms.
Disadvantages of Logistic regression:
Logistic Regression is also not one of the most powerful algorithms out there and can be easily outperformed by more complex ones.
Also, we can’t solve non-linear problems with logistic regression since it’s decision surface is linear.
Logistic regression will not perform well with independent variables that are not correlated to the target variable and are very similar or correlated to each other.
Connect with me through Linkedin and Medium for new articles and blogs.
— — — * — — — * — — — * — — — * — — — * — — — * — — — * —
“Develop a passion for learning. If you do, you will never cease to grow” Anthony J. D’Angelo
— — — * — — — * — — — * — — — * — — — * — — — * — — — * —