
Learning Statistics for Finance and FP&A - For Beginners
Why Learning Statistics is useful for Finance and FP&A professionals?
Statistics is a fundamental tool for making informed financial decisions, managing risk, optimizing portfolios, and effectively communicating financial information.
It is a critical skill for finance and FP&A professionals to excel in their roles and contribute to the success of their organizations.
Some examples of use cases are:
- Data Analysis: Finance professionals deal with large sets of financial data. Statistics provides the tools to analyze this data, identify trends, and draw meaningful conclusions. It helps in making informed financial decisions based on data-driven insights.
- Risk Assessment: Understanding statistics is crucial for assessing and managing financial risk. It enables professionals to calculate and interpret measures like standard deviation, beta, and Value at Risk (VaR), which are essential for risk management.
- Portfolio Management: For asset managers and investment analysts, statistics is indispensable for constructing and optimizing investment portfolios. Modern portfolio theory relies heavily on statistical concepts to maximize returns while managing risk.
- Financial Modeling: Building financial models is a key part of financial analysis and planning. Statistics provides the foundation for creating these models, including forecasting future financial performance and valuing investments.
- Budgeting and Forecasting: FP&A professionals use statistical techniques to develop accurate financial forecasts and budgets. These forecasts are essential for strategic planning and decision-making.
- Communication and Reporting: Being proficient in statistics helps finance professionals communicate complex financial concepts and analyses effectively to stakeholders, whether it’s through reports, presentations, or discussions.
Ok.
Now we know it’s important.
So what should we learn?
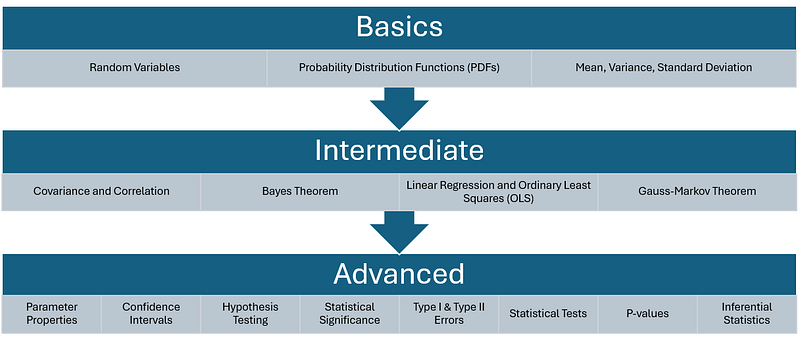
These are the 13 concepts:
- Random Variables
- Probability Distribution Functions (PDFs)
- Mean, Variance, Standard Deviation
- Covariance and Correlation
- Bayes Theorem
- Linear Regression and Ordinary Least Squares (OLS)
- Gauss-Markov Theorem
- Parameter Properties (Bias, Consistency, Efficiency)
- Confidence Intervals
- Hypothesis Testing
- Statistical Significance
- Type I & Type II Errors
- Statistical Tests (Student’s t-test, F-test)
- P-values
- Inferential Statistics
1. Random Variables
In finance, a random variable is a tool for modeling uncertain numerical outcomes.
For instance, when assessing investment returns, we consider them as random variables because they are not fixed and vary with market conditions.
Understanding random variables helps in predicting future financial trends and risks.
For a beginner, it’s crucial to grasp that random variables can be either discrete (having specific values like the number of stocks bought) or continuous (like interest rates, which can vary across a range).
2. Probability Distribution Functions (PDFs)
Probability Distribution Functions (PDFs) are fundamental in quantifying the likelihood of different outcomes in finance.
They represent how probabilities are distributed across various values of a random variable.
For example, when analyzing stock market returns, a PDF can show how likely it is to achieve different levels of return.
As a beginner, knowing about normal distribution (bell curve) is vital, as many financial variables, like stock returns, often follow this pattern.
3. Mean, Variance, Standard Deviation
These three statistical measures are pivotal in financial analysis.
The mean (average) offers a central value for a dataset, useful in understanding typical financial performance.
Variance measures how much the numbers in a dataset are spread out from the mean, which is crucial in risk assessment.
A high variance indicates a high risk and return potential.
Standard deviation, the square root of variance, is particularly important as it provides a measure of volatility.
4. Covariance and Correlation
Covariance and correlation are key statistical tools used in finance to understand how two variables move in relation to each other.
Covariance measures the directional relationship between two financial variables (like stock prices and interest rates).
However, it doesn’t provide the strength of this relationship.
Correlation, on the other hand, normalizes covariance to a range between -1 and 1, indicating both direction and strength.
A correlation of 1 means the variables move perfectly in tandem, while -1 indicates an inverse relationship.
For beginners, understanding these concepts is crucial for portfolio diversification and risk management, as they help in identifying assets that move differently from each other.
5. Bayes Theorem
Bayes Theorem is a powerful concept in statistics, particularly relevant in the context of finance for making decisions under uncertainty.
It provides a way to update our beliefs or predictions about a financial event by incorporating new evidence.
For instance, when estimating the probability of a market downturn, Bayes Theorem allows the incorporation of new economic indicators to refine this estimate.
For FP&A beginners, grasping this theorem is valuable for dynamic risk assessment and decision-making in a constantly changing financial environment.
6. Linear Regression and Ordinary Least Squares (OLS)
Linear regression is a fundamental statistical tool used extensively in financial analysis and forecasting.
It involves modeling the relationship between a dependent variable (like a stock’s return) and one or more independent variables (like economic indicators).
Ordinary Least Squares (OLS) is the most common method for estimating the parameters of a linear regression model.
It works by minimizing the sum of the squares of the differences between the observed and predicted values.
This method is crucial for FP&A professionals, as it aids in creating predictive models for financial planning and trend analysis, providing a basis for making informed financial decisions and strategies.
7. Gauss-Markov Theorem
The Gauss-Markov Theorem is one of the most important ones in the field of econometrics, particularly relevant in linear regression analysis.
It states that in a linear regression model, if the errors have a mean of zero, are uncorrelated, and have constant variance (homoscedasticity), then the Ordinary Least Squares (OLS) estimators are the Best Linear Unbiased Estimators (BLUE).
This means they have the smallest variance among all linear unbiased estimators.
When you’re using a linear regression model for finance, just remember that:
- Errors should average out to zero: On average, your predictions should be equally too high and too low.
- Errors should not be related: Mistakes in one prediction shouldn’t affect mistakes in another.
- Errors should have consistent variability: The size of your mistakes shouldn’t change depending on what or when you’re predicting.
For finance professionals, understanding this theorem is important as it underpins the reliability of regression models used in financial forecasting and decision-making, ensuring that predictions are based on the most accurate estimators available.
8. Parameter Properties (Bias, Consistency, Efficiency)
In statistics, understanding the properties of estimators — bias, consistency, and efficiency — is fundamental for accurate financial modeling.
Bias refers to the difference between an estimator’s expected value and the true value of the parameter being estimated. An unbiased estimator has zero bias.
Consistency means that as the sample size increases, the estimator converges to the true parameter value.
Efficiency, in a set of unbiased estimators, relates to the estimator with the smallest variance.
For FP&A professionals, knowing these properties helps in choosing the right statistical methods and tools, ensuring the reliability and validity of their financial analyses.
9. Confidence Intervals
Confidence intervals are a critical concept in statistical inference, providing a range of values within which the true value of a parameter is likely to fall.
In finance, they are used to express the degree of uncertainty or certainty in a sampling method.
For example, a 95% confidence interval for an average return means that there’s a 95% probability that the interval contains the true average return.
Understanding confidence intervals helps FP&A professionals in making more nuanced predictions and risk assessments, as it quantifies the uncertainty associated with any estimates made from sample data.
10. Hypothesis Testing
Hypothesis testing is a statistical method used to make inferences or decisions about population parameters based on sample data. In finance, it’s often used to determine if a certain strategy or change has a significant effect on outcomes like returns or risk.
For instance, a finance professional might use hypothesis testing to determine if the introduction of a new investment product significantly affects portfolio performance.
For beginners, understanding hypothesis testing involves setting up a null hypothesis (no effect or status quo), an alternative hypothesis (indicating some effect), and using statistical tests to determine whether the observed data provides enough evidence to reject the null hypothesis.
11. Statistical Significance
Statistical significance refers to the likelihood that a result or relationship is caused by something other than mere chance.
In financial analysis, determining statistical significance is crucial for making informed decisions, like whether a particular variable significantly impacts stock prices.
A result is statistically significant if the p-value (probability of observing the effect if the null hypothesis is true) is less than the predetermined significance level, often set at 0.05.
For beginners, it’s important to understand that statistically significant does not necessarily mean practically significant; it only indicates that the result is unlikely to be due to random chance.
12. Type I & Type II Errors
Understanding Type I and Type II errors is critical in hypothesis testing.
A Type I error occurs when the null hypothesis is true, but we incorrectly reject it.
In finance, this might be akin to assuming a new investment strategy is profitable when it isn’t, leading to potential losses.
A Type II error happens when the null hypothesis is false, but we fail to reject it.
This could be like missing out on a profitable investment opportunity because the analysis didn’t show it as significant.
For beginners, balancing these errors is key in decision-making processes, as it impacts the risk of making incorrect conclusions based on statistical tests.
13. Statistical Tests (Student’s t-test, F-test)
Statistical tests are used to make inferences or decisions about data. Two common tests are the Student’s t-test and the F-test.
The Student’s t-test is used to compare the means of two groups to see if they are significantly different from each other. In finance, this might be used to compare the average returns of two different investment portfolios.
The F-test is often used in the context of comparing variances or in conducting analysis of variance (ANOVA). For example, it can be used to test if the variances in returns for different asset classes are equal.
For beginners, understanding these tests is important for making informed decisions based on data comparisons.
14. P-values
The p-value is a statistical measure that helps to determine the significance of results obtained from a hypothesis test.
It indicates the probability of observing the results given that the null hypothesis is true.
In finance, a low p-value (typically less than 0.05) might lead to the rejection of the null hypothesis.
However, the limitations of p-values are crucial to understand. They do not measure the probability that the hypothesis being tested is true, nor do they indicate the size of an effect.
Also, p-values can be affected by the sample size — with large samples, even tiny effects can appear statistically significant.
For beginners, it’s important to interpret p-values in conjunction with other statistical measures and the practical context of the financial data.
15. Inferential Statistics
Inferential statistics involves making predictions or inferences about a population based on a sample of data taken from that population.
In financial analysis, it can be used to draw conclusions about investment risks, returns, market trends, and more.
Techniques like hypothesis testing, regression analysis, and time series analysis fall under this category.
For FP&A professionals, understanding inferential statistics is crucial for making well-supported predictions and decisions
Advanced Statistics for Finance
After mastering the foundational statistical concepts mentioned earlier, finance professionals can go into more advanced topics and techniques to further enhance their skills and capabilities.
Here are some advanced areas of study:
Time Series Analysis: This involves analyzing data points collected or recorded over time, such as stock prices, interest rates, or economic indicators. Techniques like autoregressive integrated moving average (ARIMA) models and GARCH models are used for forecasting and understanding time-dependent data patterns.
Stochastic Calculus: Stochastic calculus is essential for professionals working in quantitative finance and risk management. It helps in modeling the behavior of financial instruments and understanding complex derivatives pricing.
Monte Carlo Simulation: Monte Carlo simulation is used to model the impact of uncertainty and risk in financial scenarios. It’s valuable for pricing options, assessing portfolio risk, and simulating various financial outcomes.
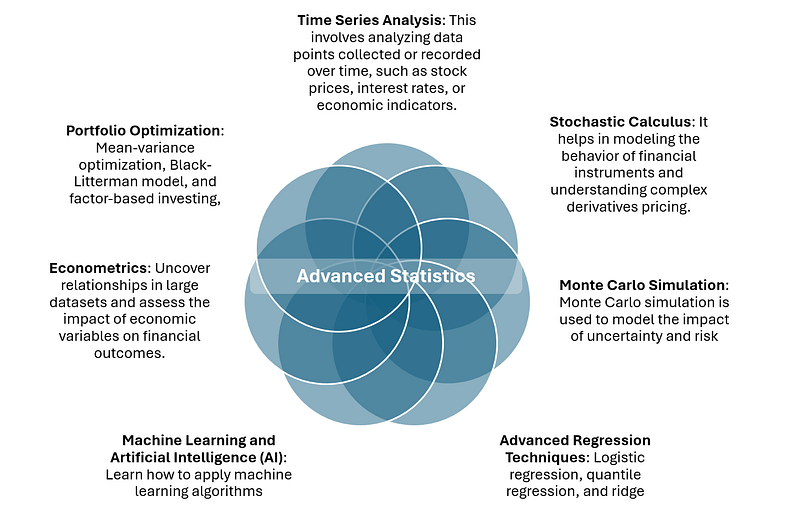
Advanced Regression Techniques: Beyond simple linear regression, professionals can explore advanced regression techniques like logistic regression, quantile regression, and ridge regression to address complex financial modeling challenges.
Machine Learning and Artificial Intelligence (AI): Learning how to apply machine learning algorithms and AI techniques to financial data can provide insights for investment strategies, risk assessment, fraud detection, and customer behavior analysis.
Econometrics: A deeper understanding of econometric techniques and panel data analysis can help finance professionals uncover relationships in large datasets and assess the impact of economic variables on financial outcomes.
Portfolio Optimization: Advanced portfolio optimization techniques, such as mean-variance optimization, Black-Litterman model, and factor-based investing, can be explored for constructing efficient investment portfolios.
Option Pricing Models: Dive into advanced option pricing models like the Black-Scholes-Merton model and its variations for pricing complex options and understanding volatility surfaces.
Financial Risk Management: Study advanced risk management techniques, including Value at Risk (VaR) methodologies, stress testing, and credit risk modeling to assess and mitigate financial risks effectively.