
MATHS FOR DATA SCIENCE
Learning Intermediate Probability principles for Data Science
Normal Distribution Theory, Sample Distribution, Central Limit Theorem

Probability is an important statistics domain, which plays a huge role in a data scientist career. From building self-driving cars, robotics, or any machine learning model, a data scientist must know how to blend statistics with programming.
In the previous article of this series, I talked about basic probability. Let’s dig into the subject a little bit deeper and learn about some important theorems in Probability, which are very crucial for a data scientist to learn and know.
Let’s continue!
Normal Distribution Theory
Let’s move into one of the most used parts of modern statistics — Normal Distribution, which is the basis for all of the testing. In the previous article, we only talked about two or three coin flips. But, in real-life scenarios, there are thousands of data points. What then?
Normal Distribution as an approximation to the Binomial Distribution is much more practical.
Let’s take off with Binomial Distribution:
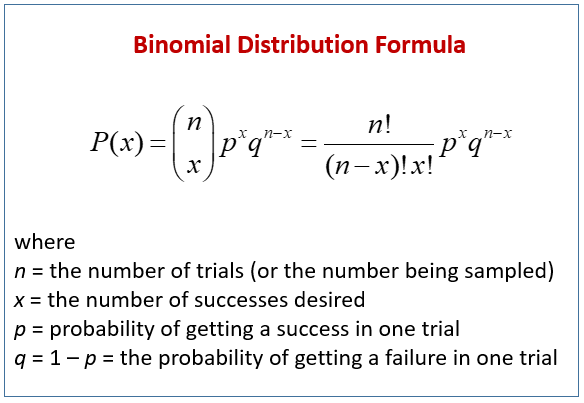
Let’s say we have to perform 20 coin flips. And, it is a fair coin with P(H) and P(T) being 0.5 both. What value of “x” will maximize our expression? It means what value will give us the maximum value of P(x).
Using Hit and Trial, you can choose for the lowest value “1”, the highest value “20”, and the mid-value “10”. If you notice, when x is 1 or 19, it will output significantly low value. While with x=10, the value of P(x) is at its peak.
In 1000 trials, we flipped our coins 20 times each and look for the most likely outcome i.e 10.
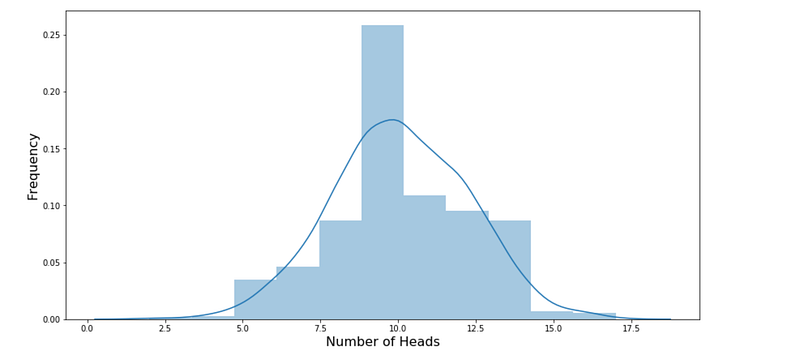
Now, the main question is
Is there a better formula for this bell-shaped curve?
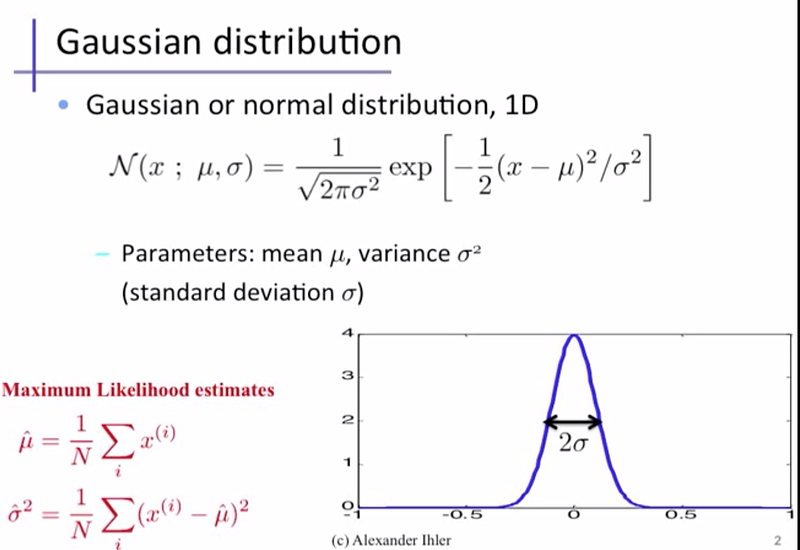
Normal Distribution, aka the Gaussian distribution, is a bell-curve distribution about the mean, showing that most frequent occurrences lie on the mean. As the data points go far from the mean, the frequency of occurrences become less.
Winding up, if you are a doctor and you have just 1 patient. You can simply think of it as a coin flip. If you have 10 patients, Binomial Distribution is your go-to solution. But, what if you have 10,000 patients?
Normal Distribution is your only friend!
Sampling Distribution
Before we dive into the Central Limit Theorem, let’s understand the term Sampling Distribution first.
A sampling distribution is a distribution of a statistic. This could be any statistic.
What does it really mean to look at the distribution of a statistic?
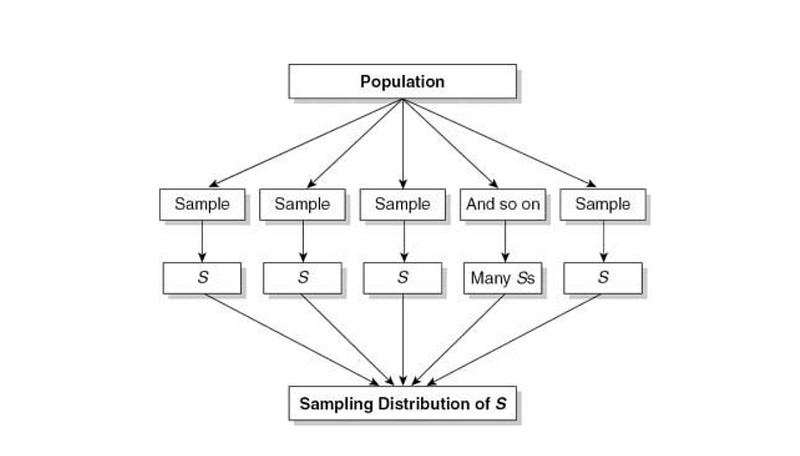
For example, a doctor has 20 patients. Out of which 80% of the population is not suffering from Tuberculosis. Now, we took out a sample of 5 students out of 20 in which 3 of them are suffering from Tuberculosis. Then, we took another sample of 5 students in which none of them suffered from the disease.
You should have noticed although our sample was still 5 students, the statistics changed. JUST BECAUSE OUR SAMPLE CHANGED!
We could select all possible combinations of 5 samples and recompute the proportion of the patients having Tuberculosis for each sample. If we were to check how each sample varies to the next i.e if we look at the distribution of proportion across all sizes of sample five. This is what is known as “Sample Distribution”.
There are two main theorems working with Sample Distribution :
Law of Large Numbers and Central Limit Theorem
Law of Large Numbers
Law of Large Numbers states that as our size of sample increases, the sample mean gets nearer to the mean of the population.
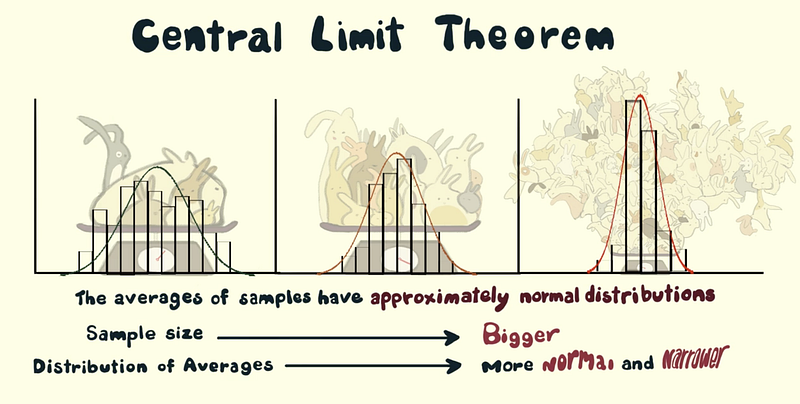
Central Limit Theorem
The Central Limit Theorem, on the other hand, says that a large size sample size will normally distribute the sampling distribution of the mean.
The Central Limit Theorem actually applies for these statistics:
- Sample means
- Sample proportions
- The difference in sample means
- The difference in sample proportions
Mathematical theorems like CLT leads to gaps in whether we have achieved a large sample size or which statistics the theorem applies to.
Let’s say a doctor has 100 patients. They all come to the clinic at once to check whether they are COVID-19 positive or not. It is very tedious to check all of them at once and calculate the mean of the positive resulted population.
Instead the doctor could create a sample of 10 patients, calculate the sample mean of those 10. He will do the same process 10 times to reach his hundredth patient.
Then, he can check the mean of all those sample mean and come at a result. That, this percentage of his patients tested positive.
As the sample size increases, the situation starts resembling more like a Normal Distribution.
Summary
I have listed some of the probability concepts and theorems above which include:
- Normal Distribution Theorem
- Sample Distribution
- Law of Large Numbers
- Central Limit Theorem
In my next article, I will be talking about Confidence Intervals and Hypothesis Testing.
Peace!


