
[LEAKED API] Parsing Information of Fear and Greed Index (cnn.com)
TL;DR: This tutorial is just for educational purposes, not for private usage. Some years ago, I started a private program that was fetching minutely the fear and greed index. I wanted to update it, but instead, I discovered an open API.
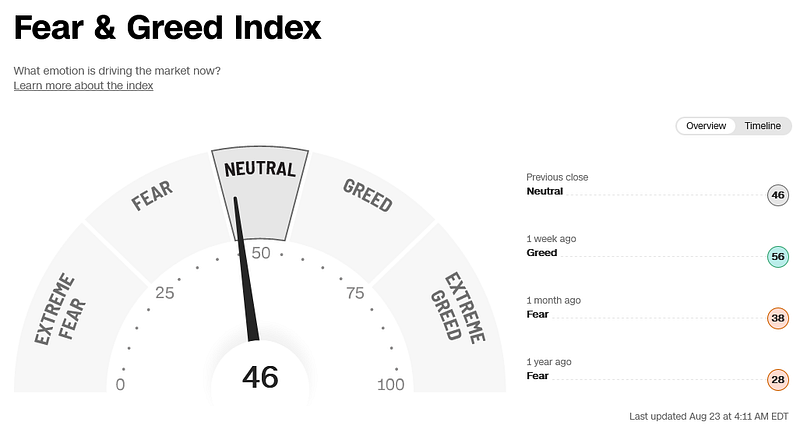
Some years ago, I wrote a simple python script to scrape the fear and greed index minutely to see, how the index was correlating to the market. If the index was below 30, it would give me an alert on my smartphone. This program ran on pythonanywhere.com*. Unfortunately, it stopped working because CNN changed their websites.
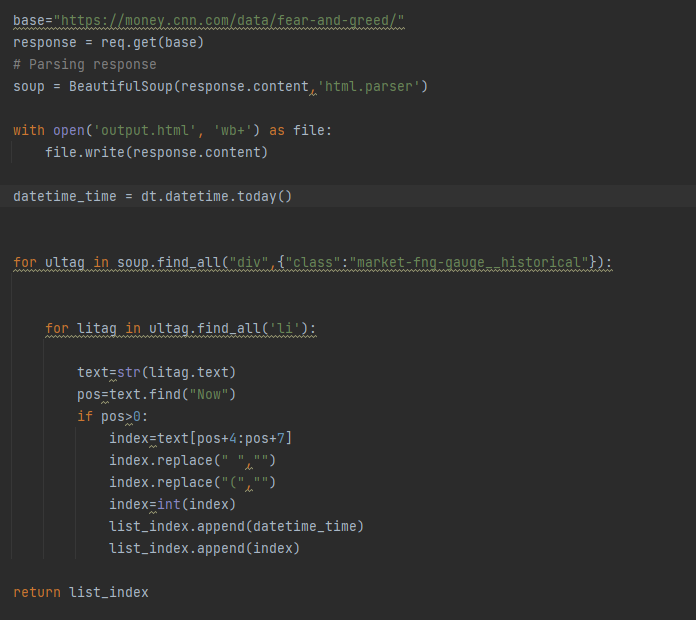
Here is the program:
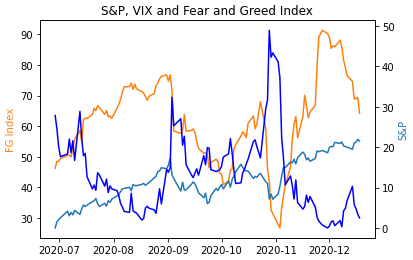
I discovered that whenever the Fear and Greed Index (orange line) is below 50 the volatility index (dark blue line) is rising and the S&P 500 Index (light blue) is falling, so a good entry for a buy.
Unfortunatley cnn.com has no official API to get the fear and greed infos from their website, but I am sure, a lot of people would be interested in it.
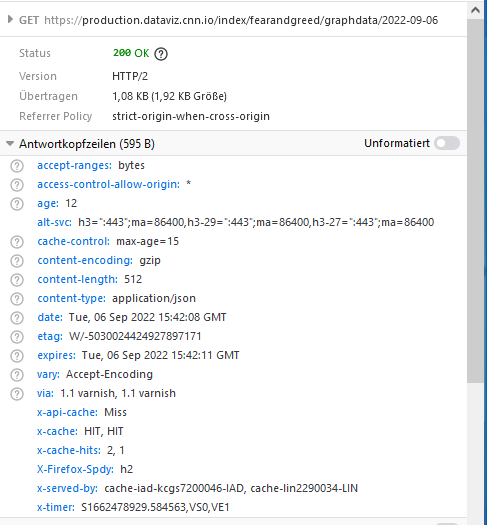
As I said, I wanted to showcase and update this project, when I discovered the API for the fear and greed index in the developer consoles (on windows F12). Everyone can access this console and it is totally legal. You see in the screenshot below of the developer consoles from https://edition.cnn.com/markets/fear-and-greed, that there is a valid GET request (code 200).
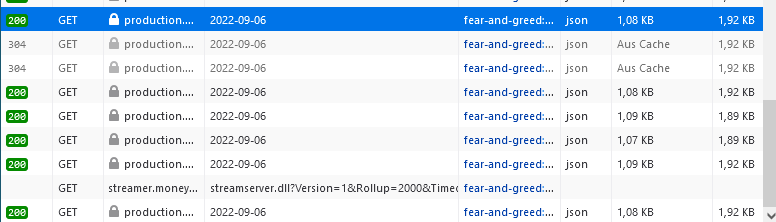
If you click on it, highlighted in blue, you see this API behind the GET parameter.
If you put this API in a new browser window, a json response is appearing (see below).
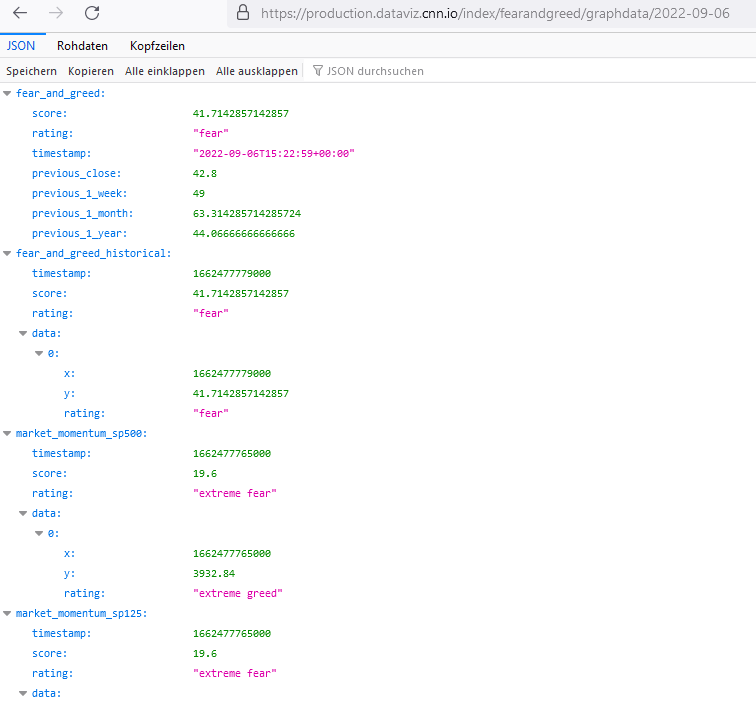
The earliest date I could retrieve is the 2020–08–03T00:00:00.000Z (1596412800000). So not bad.
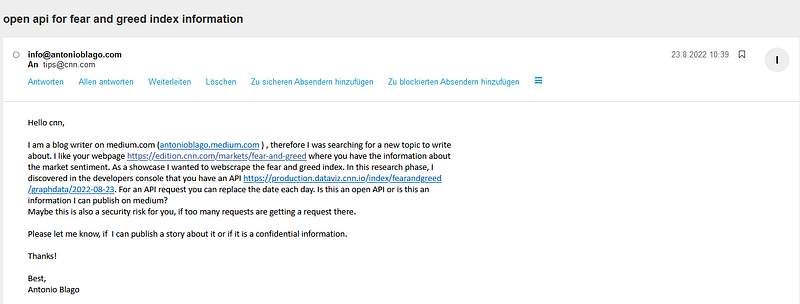
Of course, I also informed CNN via email (see below) some weeks ago about my discovery. But they did not answer yet. Maybe, they are not interested.
API Request
Just for a showcase, I am showing you how you can retrieve the data via this API. It is only for educational purposes. We are setting up via request library.
pip install requestsThen paste in the URL. We are also setting a header to avoid bot detection.
url = r"https://production.dataviz.cnn.io/index/fearandgreed/graphdata/2020-09-06"headers = {'User-Agent': 'Mozilla/5.0 (Windows NT 6.1; WOW64; rv:20.0) Gecko/20100101 Firefox/20.0'}
response = req.get(url, headers=headers)We retrieve this information:
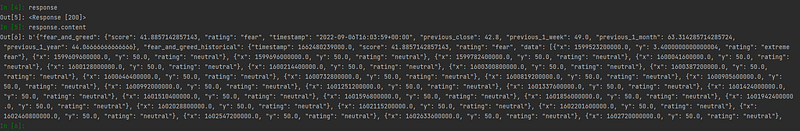
We want to read and store this information in a more readable way as a dataframe. We need the ast library to read the bytes object and convert it to a dictionary.
import astbyte_obj = response.content
dict_str = byte_obj.decode("UTF-8")
mydata = ast.literal_eval(dict_str)
We can now access the dictionary via the index.
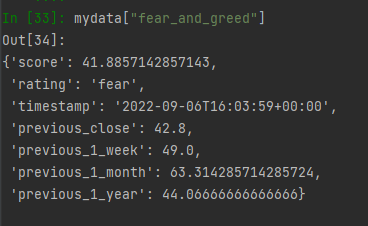
We save the historical data in the dictionary to a pandas DataFrame.
historical_fg = pd.DataFrame(mydata["fear_and_greed_historical"]["data"])

historical_fg["x"] = pd.to_datetime(historical_fg["x"], unit='ms')
historical_fg = historical_fg.rename(columns =
{"x":"Date","y":"value"})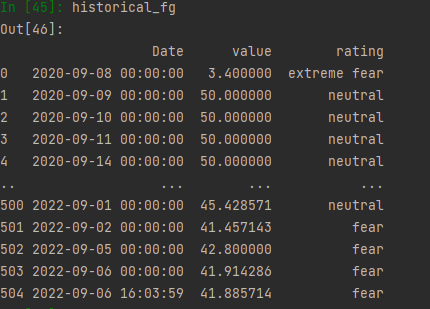
We can make a little plot:
import matplotlib.pyplot as pltdef create_plot(data):
fig, ax = plt.subplots()
ax.plot(data.Date, data['value'], color="tab:orange",
label="Fear and Greed Index")
ax.legend()
plt.xticks(rotation=45)create_plot(historical_fg)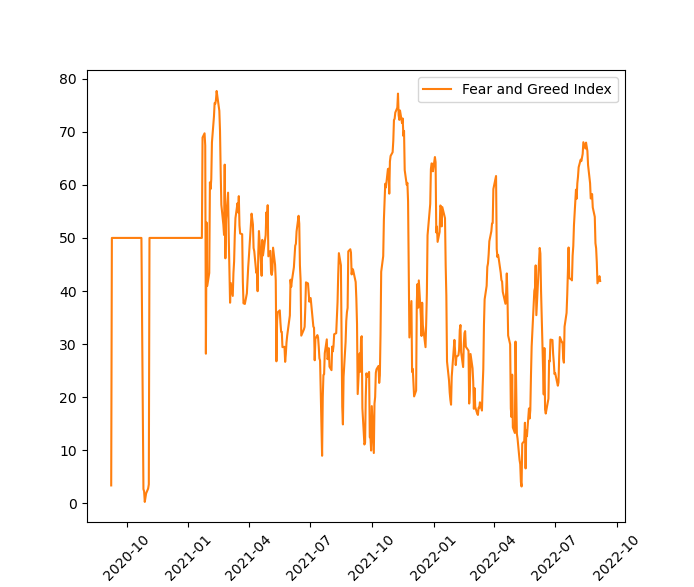
Nice! That was fun. I hope you liked it and you got some value from it.
👉 Please feel free to clap, share, and comment. Follow me for more content about cryptos, stocks, data analysis, and web development.
- Check out my webpage and get in touch with me on Linkedin: www.antonioblago.com
- Make a free account on my stock and crypto tracking tool: www.tenxassets.com
- If you like to develop web apps, I recommend you pythonanywhere.com* as a hosting service.
- *these are affiliate links
A Message from InsiderFinance

Thanks for being a part of our community! Before you go:
- 👏 Clap for the story and follow the author 👉
- 📰 View more content in the InsiderFinance Wire
- 📚 Take our FREE Masterclass
- 📈 Discover Powerful Trading Tools


