
Know Everything about the MACD
Technical analysis is an essential tool for traders and investors who want to make decisions in the financial markets. One of the most widely used indicators in technical analysis is the Moving Average Convergence Divergence (MACD).
The MACD is a versatile indicator that can be used to identify trends, reversals, and divergences, among other things.
In this article, we will explore the MACD in-depth and discuss everything you need to know to use it effectively.
What is the MACD?
The Moving Average Convergence Divergence (MACD) is a popular technical analysis indicator that was developed by Gerald Appel in the late 1970s.
The MACD is calculated by subtracting a 26-period Exponential Moving Average (EMA) from a 12-period EMA. This calculation produces a MACD line, which is used to identify changes in momentum and trend.
In addition to the MACD line, the indicator also generates a signal line, which is a 9-period EMA of the MACD line. When the MACD line crosses above the signal line, it generates a bullish signal, indicating that the trend is likely to continue upwards. Conversely, when the MACD line crosses below the signal line, it generates a bearish signal, indicating that the trend is likely to continue downwards.
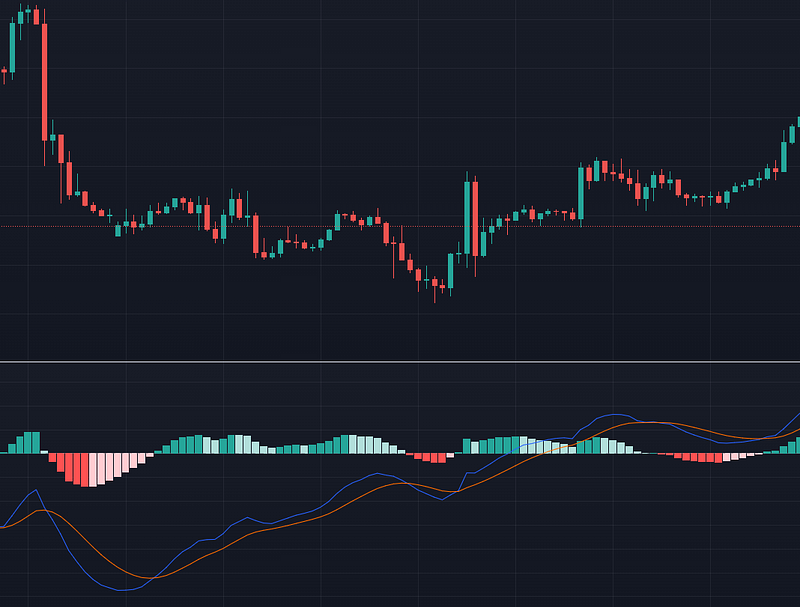
The MACD indicator also produces a histogram, which is a visual representation of the difference between the MACD line and the signal line. When the histogram is above the zero line, it indicates that the momentum is bullish. When the histogram is below the zero line, it indicates that the momentum is bearish.
How to Use the MACD
The MACD is a versatile indicator that can be used in a variety of ways to make trading and investment decisions. Here are some of the most common ways to use the MACD:
- Identifying trends: The MACD can be used to identify trends in the market. When the MACD line is above the signal line, it indicates a bullish trend, and when the MACD line is below the signal line, it indicates a bearish trend.
- Spotting trend reversals: The MACD can also be used to identify potential trend reversals. When the MACD line crosses above the signal line, it generates a bullish signal, indicating that the trend is likely to continue upwards. Conversely, when the MACD line crosses below the signal line, it generates a bearish signal, indicating that the trend is likely to continue downwards.
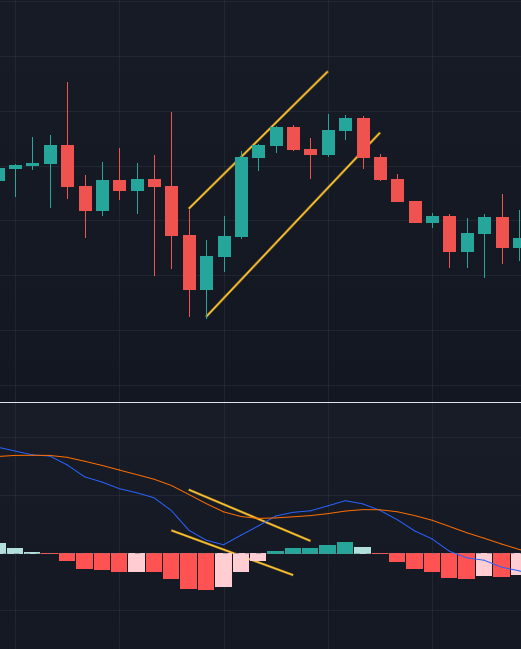
- Finding divergences: Divergences occur when the price of an asset moves in the opposite direction of the MACD. For example, if the price of an asset is moving upwards, but the MACD is moving downwards, it indicates a bearish divergence.
- Using the histogram: The histogram can be used to identify changes in momentum. When the histogram is above the zero line, it indicates that the momentum is bullish. When the histogram is below the zero line, it indicates that the momentum is bearish.
Combining the MACD with Other Indicators
No indicator can work on its own. That’s why, to make decisions, you should combine the MACD with other indicators such as:
- Moving Averages: Moving averages can be used in combination with the MACD to confirm trend changes. You can look for a cross of the MACD line and signal line, and then wait for the price to cross above or below a moving average before entering a position.
- Relative Strength Index (RSI): The RSI is another popular technical indicator that can be used in combination with the MACD to confirm trend changes. You can wait for the MACD to generate a signal, and then confirm the signal with an oversold or overbought reading on the RSI.
- Bollinger Bands: Bollinger Bands can be used in combination with the MACD to identify potential breakouts or trend reversals. You can wait for the MACD to generate a signal, and then look for a breakout above or below the upper or lower Bollinger Band to confirm the signal.
Common Mistakes When Using the MACD
While the MACD is a powerful technical indicator, it’s important to be aware of common mistakes that you can make when using it.
- Overreliance on the MACD: The MACD should be used in conjunction with other technical indicators and analysis methods. Relying solely on the MACD can lead to missed opportunities and inaccurate trading decisions. There’s no indicator that can be used on its own in trading.
- Ignoring Divergences: Divergences are an important signal that can help identify potential trend reversals. Failing to take divergences into account can lead to missed opportunities or incorrect decisions.
- Using Default Settings: The default settings of the MACD may not be appropriate for all trading and investment strategies. You should understand how is the MACD calculated, to understand how you can modify its settings to fit your strategy.
- Failing to Consider Market Conditions: The MACD may work well in some market conditions and not in others. One example: the MACD is nearly useless in a trendless market.
Final Note
The MACD is a powerful indicator, and one of the most used. However, it’s important to remember that no single indicator can predict the future with certainty, and you should always practice proper risk management and use a variety of tools and strategies when making decisions.
If you’re interested in learning more about technical analysis, feel free to follow me and check my other articles in the links below!
To explore more of my trading stories, click here! You can also access all my content by checking this page.
If you liked the story, don’t forget to clap, comment, and maybe follow me if you want to explore more of my content :)
You can also subscribe to me via email to be notified every time I publish a new story, just click here!
If you’re not subscribed to medium yet and wish to support me or get access to all my stories, you can use my link:
A Message from InsiderFinance

Thanks for being a part of our community! Before you go:
- 👏 Clap for the story and follow the author 👉
- 📰 View more content in the InsiderFinance Wire
- 📚 Take our FREE Masterclass
- 📈 Discover Powerful Trading Tools


