
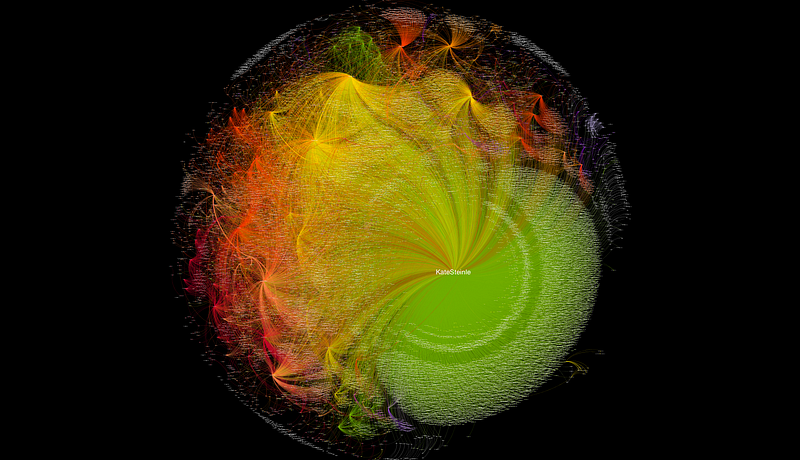
#KateSteinle hashtag visualizations
Hashtags associated with the #KateSteinle verdict were megaphoned by at least 37 cyborgs that are tweeting between 47 to 739 tweets per day, including a brand new account that changed its “identity” mid-campaign. These supercharged accounts amplified hashtags that began as an angry public reaction to the Kate Steinle verdict but turned into a digital campaign of ethnic intimidation against immigrants.
I started capturing tweets for hashtags associated with the #KateSteinle verdict on November 30 at 9:30pm est. From November 30 to December 2 at 11am est, I documented 37 accounts that are tweeting more than humanly possible and amplifying hashtags. There are more than 37 and they may not be intentionally coordinating together, however the effect of these cyborgs tweeting the same hashtags in the same time frame is like an engine running in the background, driving up the quantities of tweets and magnifying the reach of the trends.
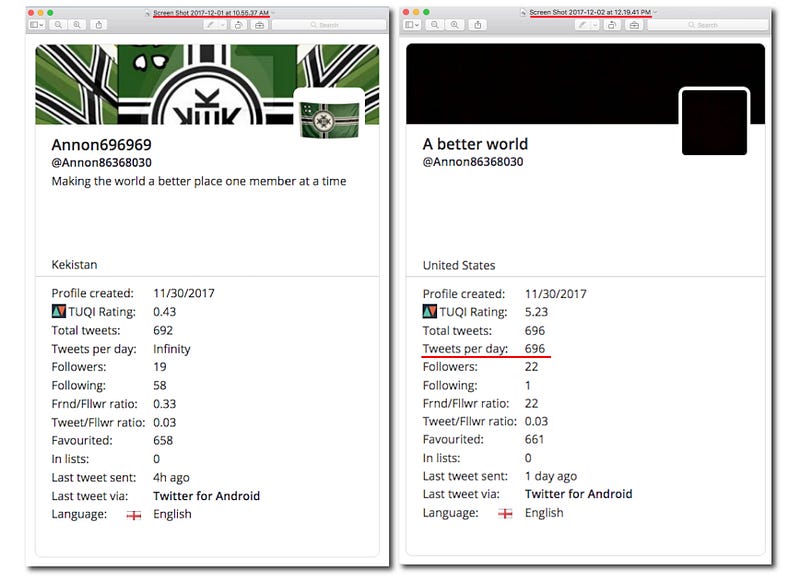
The first account I looked at in this hashtag — Annon86368030 — was one of the top users for several hashtags and it appeared abnormal in gephi graphs. This is a brand new account that was created on November 30. Below you can see the account’s profile as it appeared when I found it on Friday morning December 1 and the after screenshot from December 2 when it changed to a plain black avatar and header image and changed its location from Kekistan to United States.
Despite being a brand new account, Annon86368030 managed to tweet 696 tweets in about one day. A full list of the 37 accounts can be found towards the end of this post.
I rendered the following graphs on December 1 after capturing tweets for several hashtags overnight from November 30 to December 1.
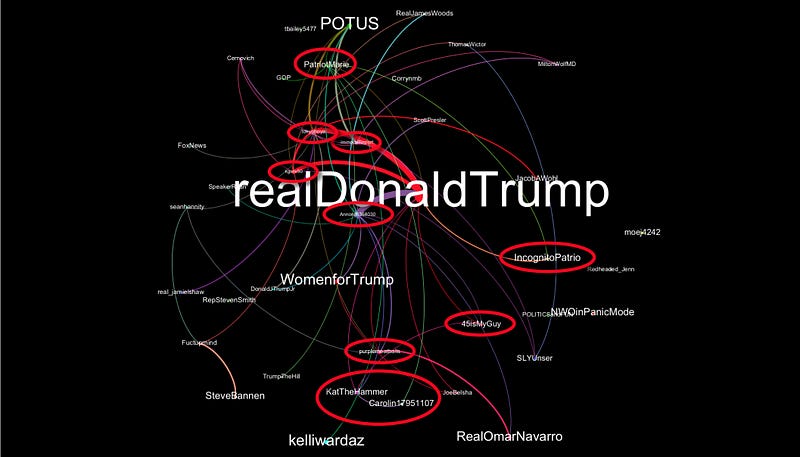
I made two different kinds of network graphs for this blog: user-to-hashtag graphs (u2h) and user-to-user graphs (u2u). Most of my previous blogs are user-to-user graphs which show the largest accounts influencing a hashtag or given search term.
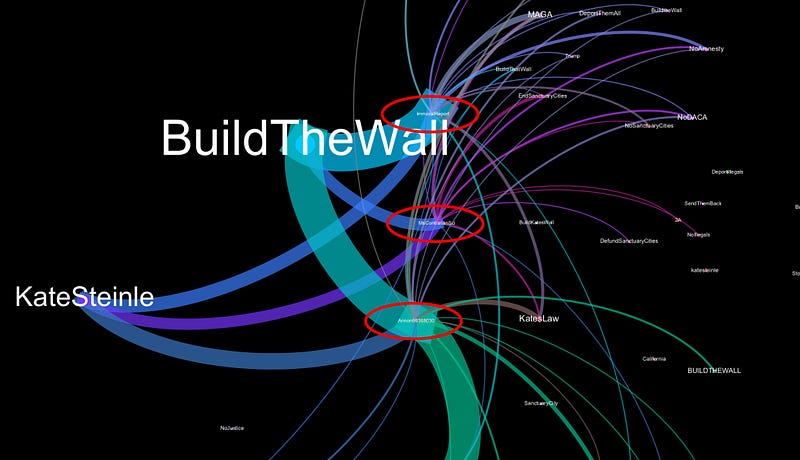
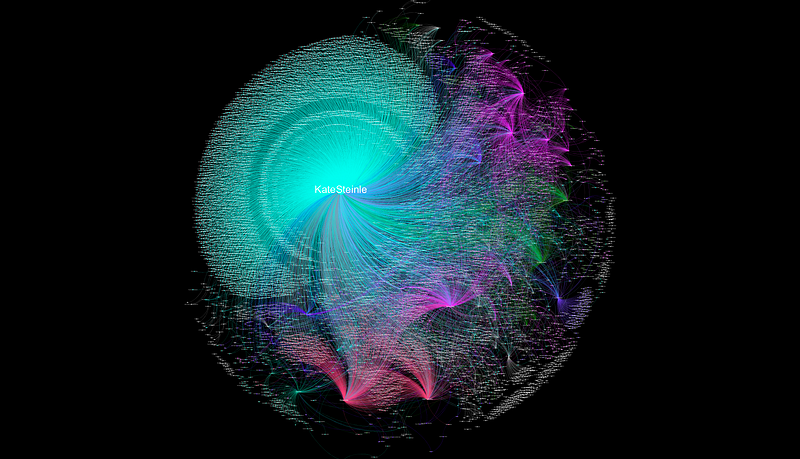
User-to-hashtag (u2h) graphs, like the graph below, are slightly different. The nodes in u2h graphs show the users who are tweeting and the hashtags their accounts are connecting to. The hashtags are the most visible nodes instead of the accounts.
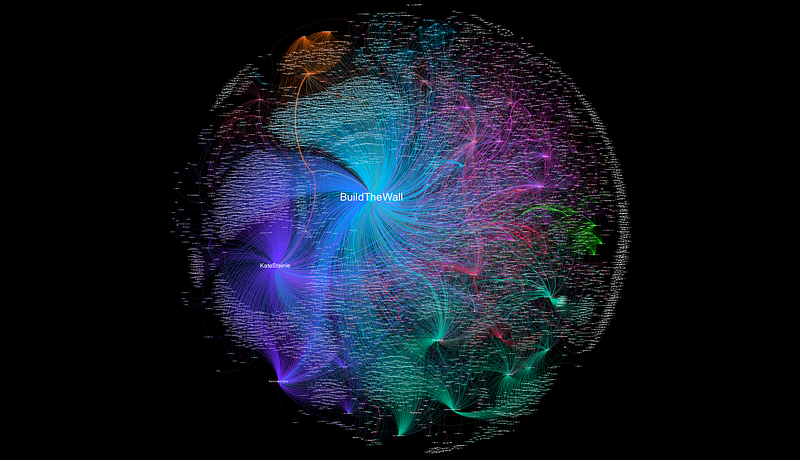
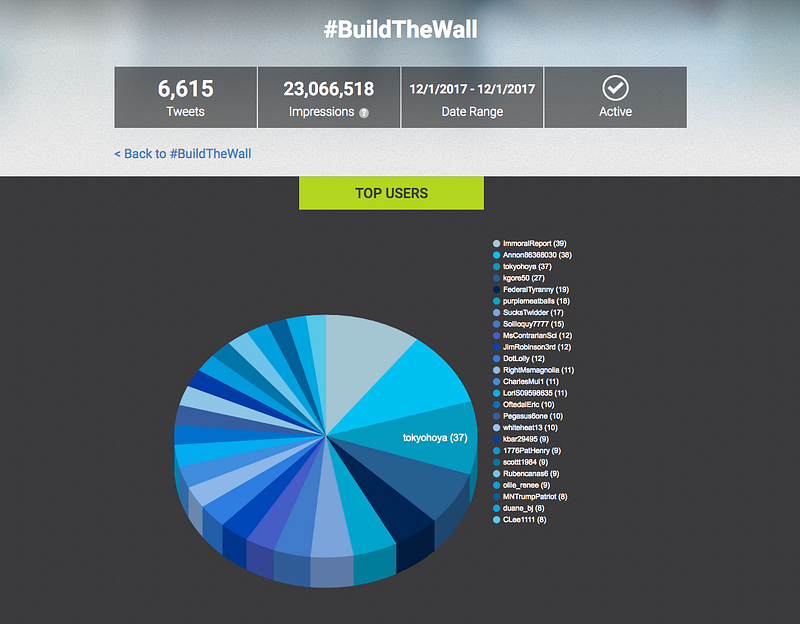
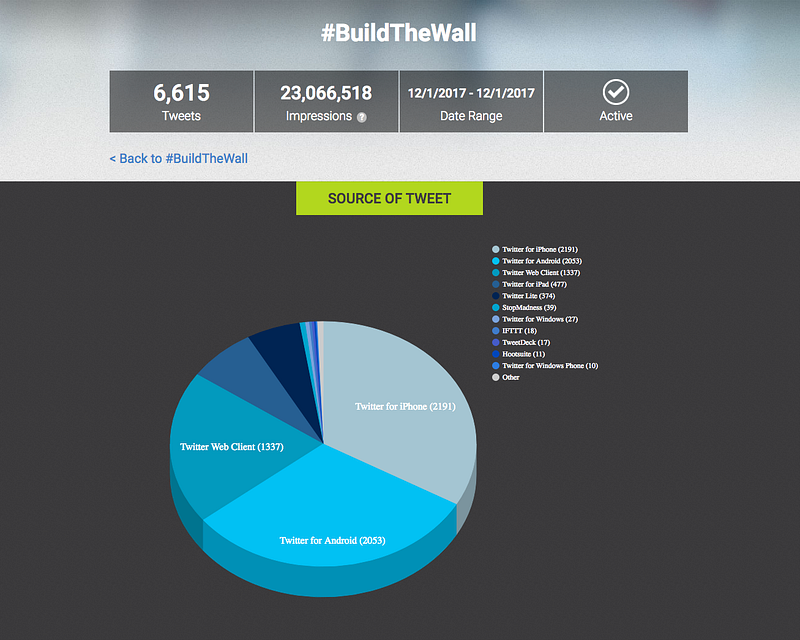
#BuildTheWall
Tweets: 6,615 User to hashtag network (u2h) Nodes: 5,431 Edges: 13,306 Communities: 361 Impressions: 23,066,518
#BuildTheWall
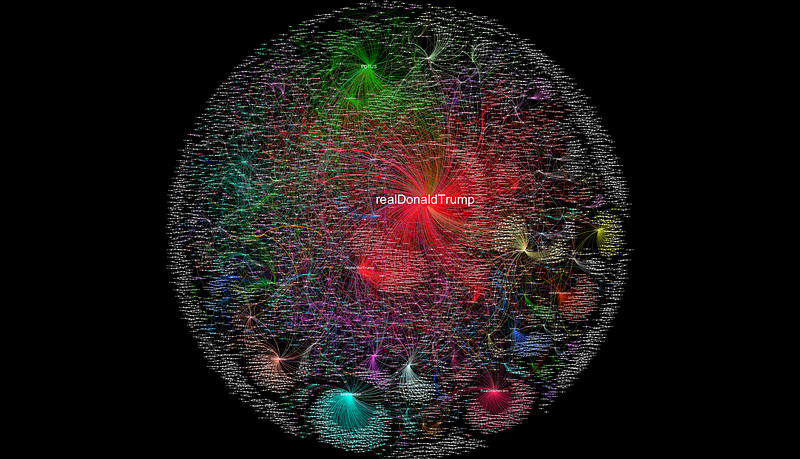
Tweets: 6,615 User to user network (u2u) Nodes: 5,620 Edges: 8,597 Communities: 702 Impressions: 23,066,518
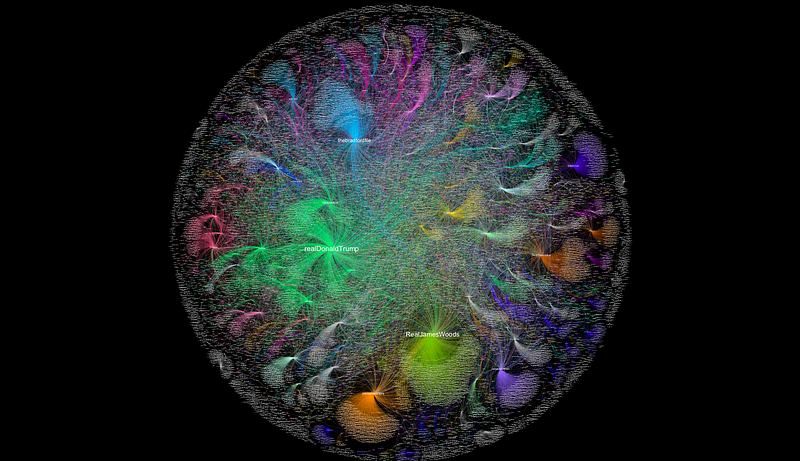
The user-to-user network shows the largest nodes, what could be considered the influencers due to the size of their accounts and retweets they received.
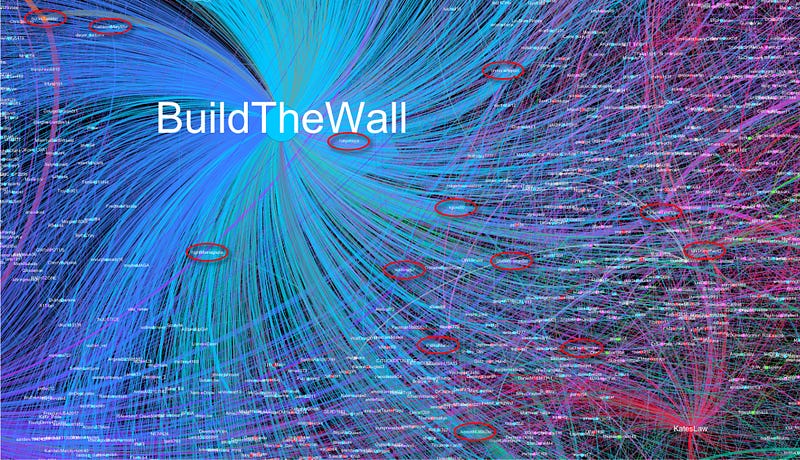
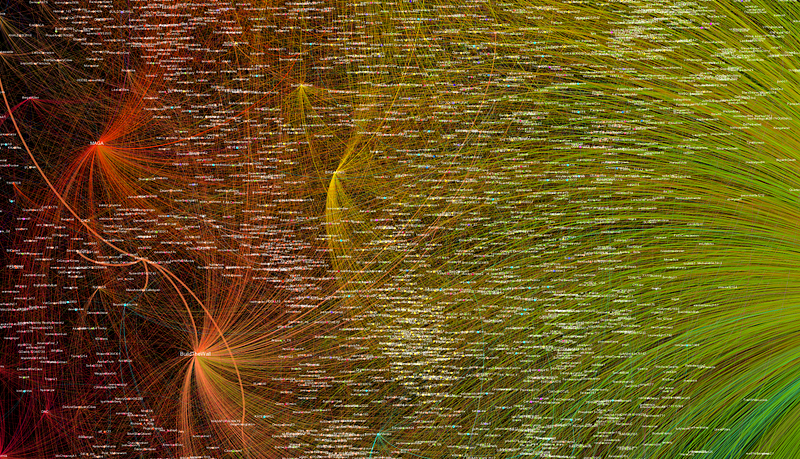
The cyborgs are difficult to detect but filtering the network by edge weight, shows the accounts that are tweeting more than normal. This filter removes edges with a weight of 1 (accounts that only tweeted the hashtag once for example) and highlights the accounts that are working overtime. Several of the cyborgs retweeted Donald Trump’s account as well as many tweets that included the hashtags and Trump’s Twitter handle. These tweets would include anyone mentioning Trump’s handle in their own tweets as well as any replies to Trump’s tweets.
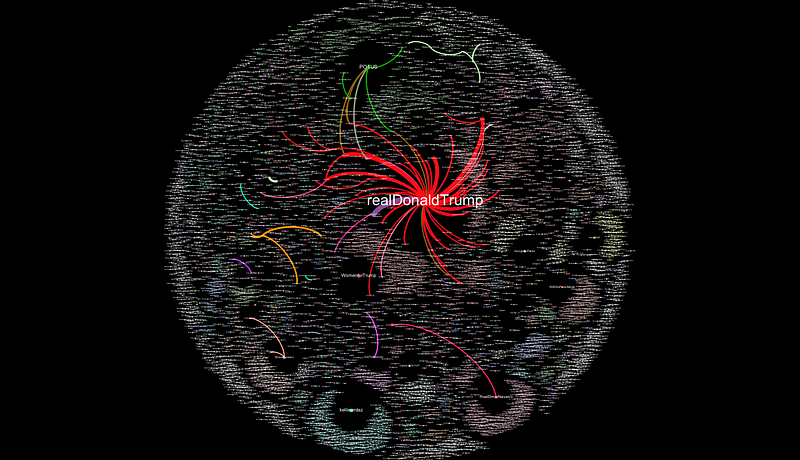
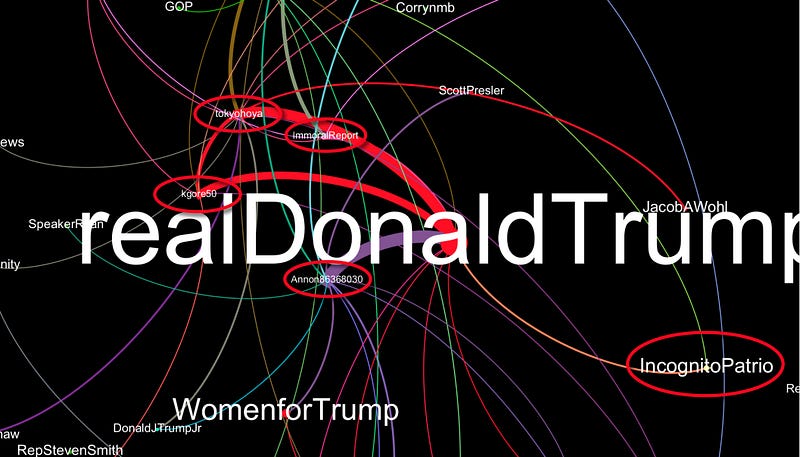
Zooming in to the filtered network, the cyborgs are more obvious. Their increased activity is causing the edges connecting them to Donald Trump’s account to appear heavier than normal.
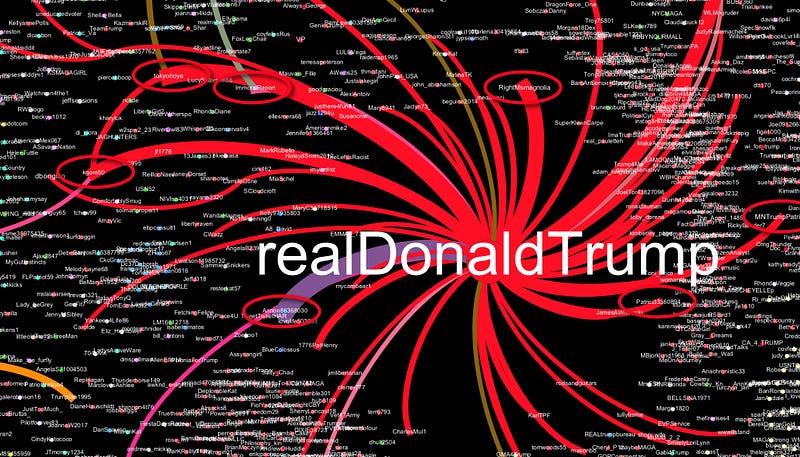
Filtering the same network by degree range removes the noise and highlights only the influencers. Two of the accounts I’ve highlighted below, kgore50 and tokyohoya, don’t appear to be tweeting excessively like the others. kgore50 has not tweeted much at all since the account was created in June 2014 however on November 30 this account started retweeting hundreds of tweets with hashtags associated with the Kate Steinle verdict.
tokyohoya averages about 16 tweets per day but has been very active tweeting in these hashtags so they also show up as an influencer. Both of these accounts were in the top users for #BuildTheWall and #KateSteinle. I’m not sure if I would classify these two accounts as cyborgs based on their activity in these hashtags alone but they were very active in these trends.
Many of these cyborgs appear to be tweeting from the usual sources, iPhone, Android and Twitter Web Client, which are the most common sources of tweets worldwide but there is some obvious automation in #BuildTheWall.
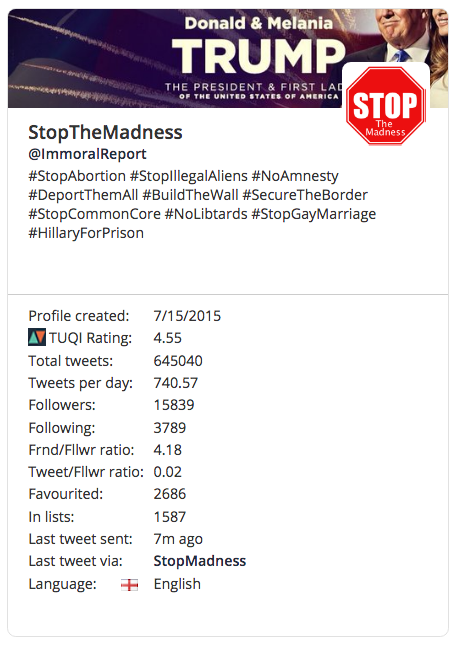
ImmoralReport tweets are coming from a source called “StopMadness” which I assume is an app that connects to the Twitter API. The ImmoralReport account is tweeting 740 tweets per day. It’s the most active account in the #BuildTheWall hashtag. Annon86368030 mentioned above is the second most active account tweeting 696 tweets per day.
I found the same cyborgs in several hashtags associated with the Kate Steinle verdict including the main hashtag: #KateSteinle.
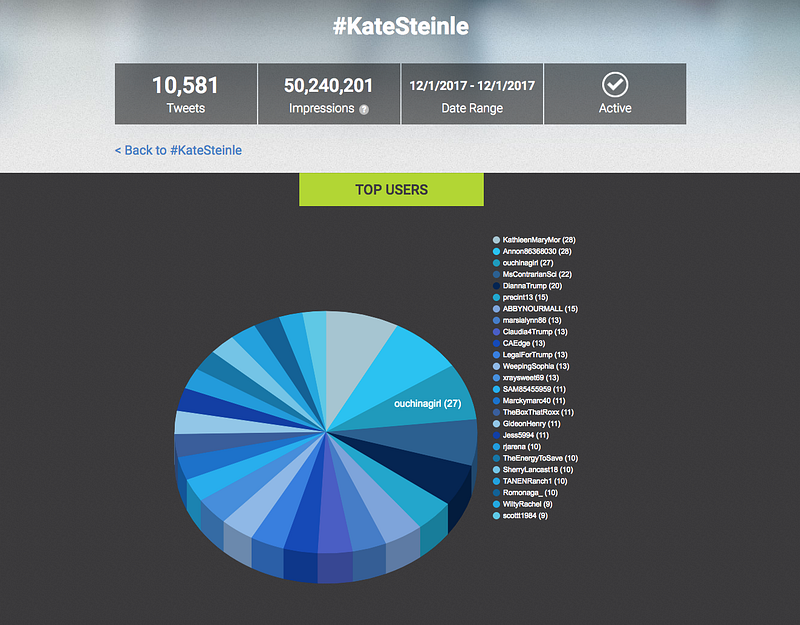
#KateSteinle
10,581 tweets User to hashtag network (u2h) Nodes: 7,992 Edges: 13,079 Communities: 321 Impressions: 50,240,201
Again the cyborgs are hard to detect viewing the full network at 100% visibility but filtering the network by degree range and zooming in reveals several of the cyborgs in the #KateSteinle hashtag, amplifying tweets and connecting to many other hashtags associated with the Kate Steinle verdict.
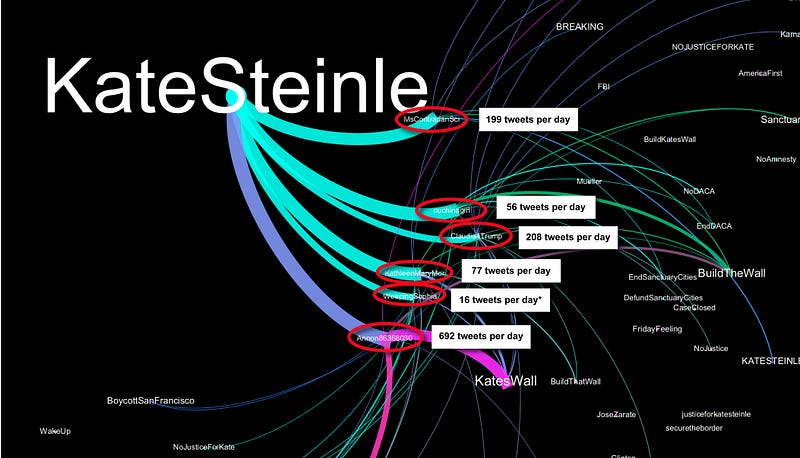
*The WeepingSophia account seems like a normal account that according to social bearing tweets about 16 tweets per day but has been tweeting and retweeting a lot of tweets in the #KateSteinle trends over the past two days.
As with all Twitter networks I’ve graphed, there are never 100% pure bots or 100% real people in any hashtag, it’s always a mix and difficult to separate real people from fake accounts. Regardless if WeepingSophia is a bot, a cyborg or a normal person who is just tweeting a lot because they’re angry about the Kate Steinle verdict, the cyborgs plus the normal accounts tweeting together cause emergent effects, amplifying the hashtags the accounts are tweeting and boosting the network’s overall reach.
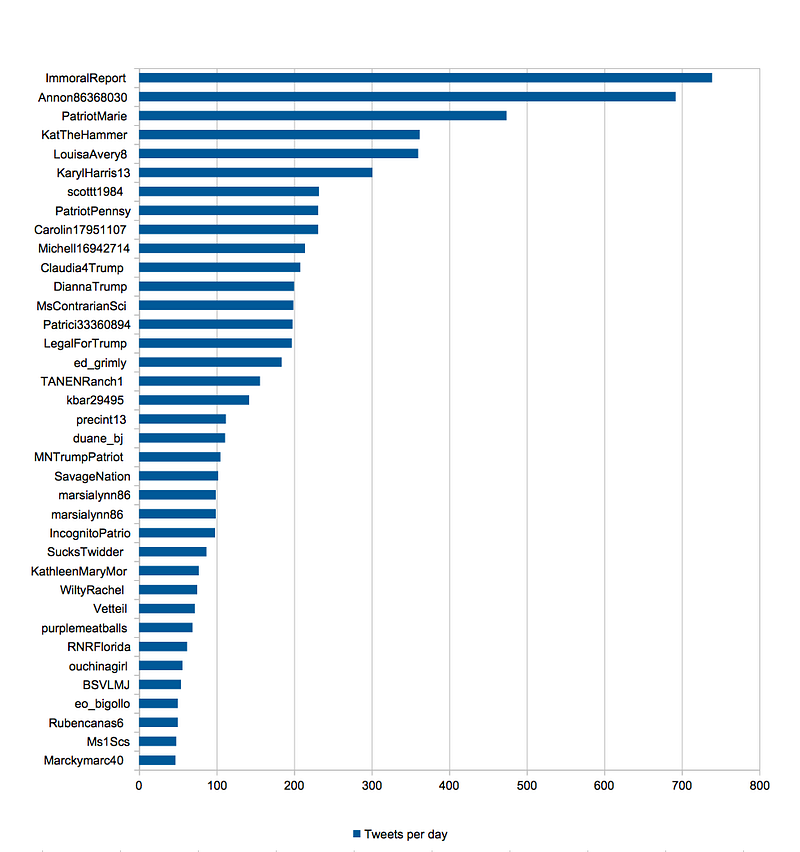
Here is the list of the 37 most active cyborgs I found over the past 2 days. There are more but these were the obvious accounts that were tweeting the most tweets. I started the list with Marckymarc40 who was tweeting 47 tweets per day — the least active account — and ended at ImmoralReport who was tweeting 739 tweets per day and was the most active account.
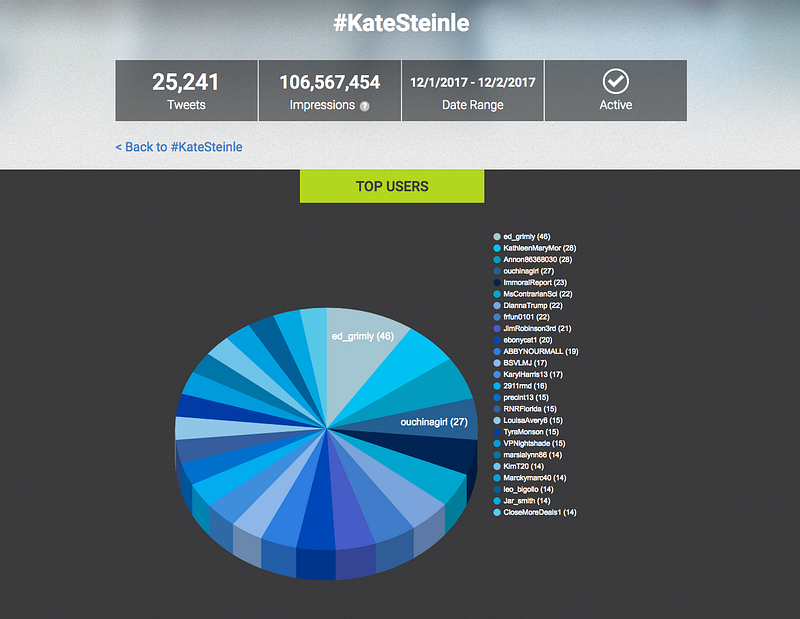
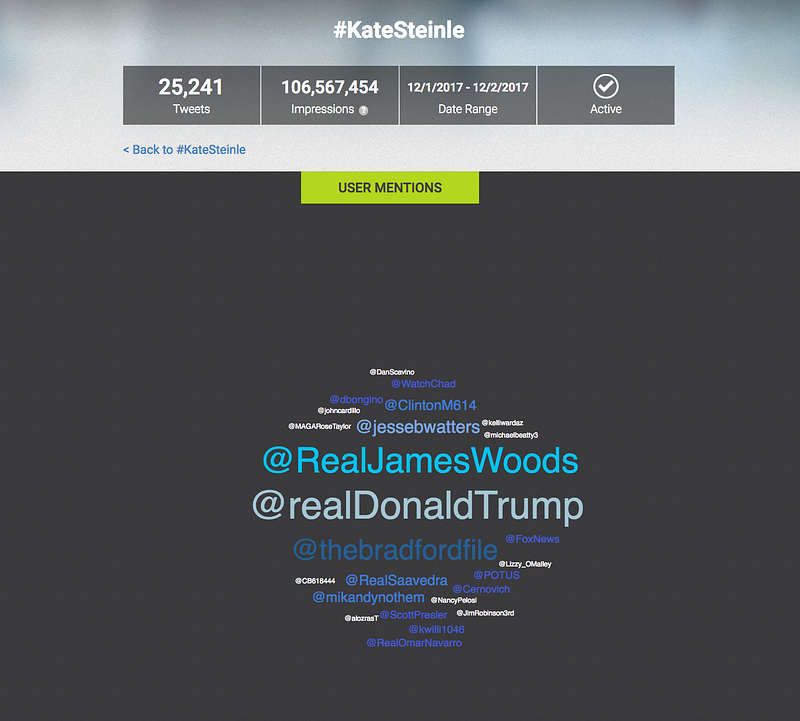
As of December 2, I captured 25,241 #KateSteinle tweets and the below infographic shows the top users in the hashtag at that time. All of the cyborgs can be found in the top users for each hashtag mixed in with other accounts that appear to be real people.
#KateSteinle
25,241 tweets User to hashtag network (u2h) Nodes: 17,562 Edges: 32,779 Communities: 536 Impressions: 106,567,454
#KateSteinle
25,241 tweets User to user network (u2u) Nodes: 18,203 Edges: 28,400 Communities: 1337 Impressions: 106,567,454
The user mentions in the infographic below were the most visible accounts in the Kate Steinle hashtags and boosted the reach of the trend, but the cyborgs were also driving the trends in the background. I don’t know how to measure the effects of cyborgs in a hashtag but they definitely have an effect.
I mentioned emergence above which is something to be mindful of when thinking about complex networks like Twitter hashtags. Each component of the network on its own has certain characteristics (for this example let’s say the components are cyborgs, large verified accounts, and real people). But when combined, the components take on new characteristics. The components can do things together as a unit that they can’t do alone. In this case, the result seems to be the formation of a large broadcasting system.
Whenever something happens in the news, everyone immediately goes to social media to talk about it. This is normal, it’s what we do now. And I think it’s fine if people are angry and want to tweet or post about their anger, that’s normal too. I think it’s good that we can log on to social media networks and talk to people we agree with and also argue with people who disagree.
That’s not what’s happening in the hashtags associated with the Kate Steinle verdict. I don’t know who is manipulating these hashtags but they are being manipulated. Tweets in these trends called for mass deportations, some tweets even called for people to “kick in doors.” If I was an immigrant in USA right now (documented or not) these kinds of tweets would terrify me. I believe that was the intention of whomever is manipulating these trends.
Impressions cited above are via Tweet Archivist who defines the metric as “the total number of times that the tweets of an archive have been delivered to Twitter streams. Of course, not everyone who receives a tweet will read it. As such, impressions are the largest possible audience for the given archive. Paid advertising works similarly; even though an ad was displayed on a website, there is no guarantee that a person actually saw it. Also, note that impressions does not deduplicate users, so if the same person sees a given hashtag twice, it counts as two impressions. Note that, because replies are only delivered to common followers’ timelines, they are calculated as a single impression.”
Tweets per day (TPD) cited above are via Social Bearing as of December 1–2, 2017 and those metrics can fluctuate over time. For example, the account Annon86368030 was created on November 30 and tweeted 696 tweets in a 24 hour time period, then it stopped tweeting. On December 2 the account registered 696 tweets per day but because it stopped on December 1, two days later on December 3, the metric changed to 347.5 tweets per day — which is the total number of tweets it had tweeted during that period divided by the amount of time the account has been online (about 2 days). Also note in the first screenshot the TPD says “infinity” which is what shows as TPD on social bearing for brand new accounts.
However, the Annon86368030 account exhibits very unusual activity. I’ve checked my own account many times via social bearing and as a regular Twitter user, my “tweets per day” metric doesn’t fluctuate much (my account is usually around 6–7 tweets per day). It seems like this metric could also be affected if an account deletes tweets en masse.
Gephi graphs in this blog were created using OpenOrd combined with Force Atlas 2 layout algorithms.
Date Ranges as shown in infographics are via Tweet Archivist and show date ranges from 12/1/2017 to 12/2/2017 however the datasets I analyzed above began on November 30 at 9:30pm est. The Tweet Archivist dates register as UTC time zone so 9:30pm est on November 30th registered as the next day in Tweet Archivist.