
Kafka Streams — How to Calculate Moving Average for Stock Prices in Real-time
Step-by-step guide on the advanced programming of Kafka Streams — KTable, Time Windows and Aggregation
Real time data stream processing is not limited to filtering and value transformation, the powerful framework can achieve far more complicated calculations. One typical example is the technical analysis of the stock market.
Technical indicators are intriguing as they are useful tools giving traders insights and valuable references on critical trading decisions.
The challenge is to provide technical analysis instantly with the influx of stock prices. Without a doubt, Kafka Streams is a great choice when it comes to data streams with sophisticated processing logic in real time.
Further to the basic Kafka Stream development in my previous article, I will share with you how to build a more sophisticated logic for data streams based on the examples of the popular moving average calculations for stock price.
This article is not to provide any advice on stock trading, the examples in this article are purely to demonstrate the features of Kafka Streams.
What is Kafka Streams
Kafka Streams is a client library for the data access on Kafka. Beyond the basic operations such as message publishing and reading on Kafka topics, Kafka Streams supports various operations on data so as to create a data pipeline and execute system logic as data passes through the pipeline.
The design of Kafka Streams is developer-friendly. The function calls are in the fluent style of DSL format. For example, the sample code below filters out IBM from the stock prices and calculates the median prices.
It can be done within just several lines of code which are tidy and easily readable.
Data format in Kafka is an important concept you should not ignore. Data is stored in byte arrays in Kafka. Any messages written into Kafka should be serialized from data objects into byte arrays. Vice versa, data extracted from Kafka should be deserialized from byte arrays into data objects.
Therefore, it is essential to clearly specify serialization and deserialization (SerDes in shorthand) for all operations on Kafka Streams. I will show you how with examples.
What is Moving Average?
As stock prices might be fluctuating within a short period of time, moving average is a popular tool for traders to find the overall movement in order to forecast trends.
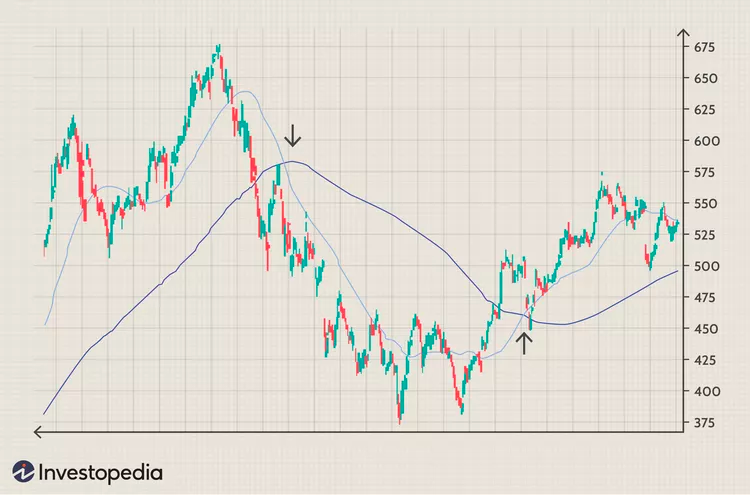
Moving average could be a short period (e.g. 20-day) and a long period (200-day). The example diagram below shows stock prices with a short term moving average and a long term moving average. The crossover between the moving average lines can be served as the signal for buying or selling.
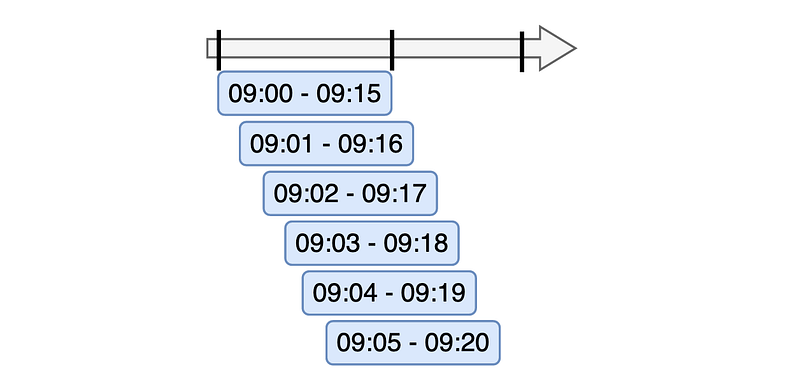
The calculation of this powerful indicator is in fact rather simple. It is an average value ( sum / count ). It is called “moving” because the data is based on a moving windows
Say, a 15-minute moving average is based on data on 09:00–09:15, 09:01–09:16, 09:02–09:17 and so on.
To calculate moving average, here is the design of data flow:
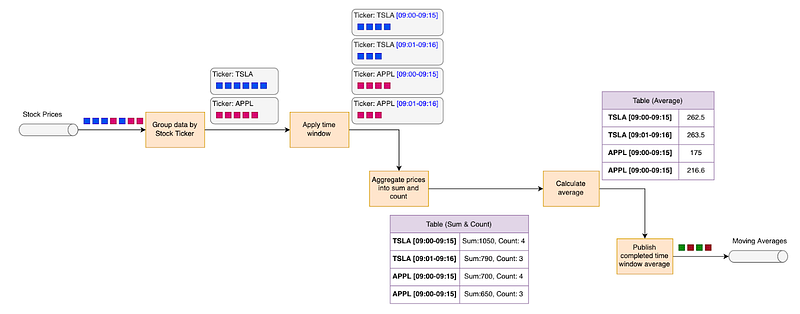
The diagram above calculate moving averages by the following steps:
- Group stock prices By tickers
- Apply time window to the data group
- Aggregate prices to produce sum and count
- Calculate average using on sum and count
- Publish average values of the complete time windows
Let’s go through each step-by-step in the following sections.
Data Streams of Stock Prices
The examples of this article are primarily based on data streams of stock prices. Imagine that high transaction volume of stock trading, stock prices are being published to Kafka rapidly in this key-value format:
Key
- Ticker
Value
- Timestamp
- Open price
- Close price
- Low price
- High price
- Volume
Group Data Streams By Stock Ticker
The first step is to connect the data stream to a topic “stock-price” for the input of stock prices. Seralizer / Deseralizer (Serde) is specified by message key (String) and value (JSON of StockPrice).
Then, group messages by tickers using groupByKey() operation in Kafka Streams.
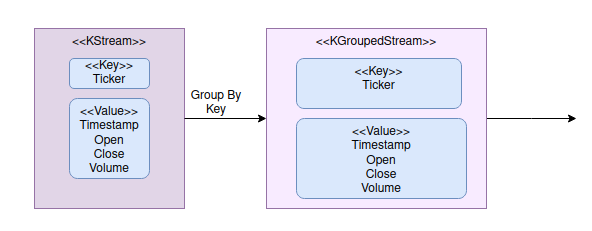
Now, we have the stock prices in groups. KGroupStream represents data streams of the grouped data. It provides the functionalities for data consolidation.
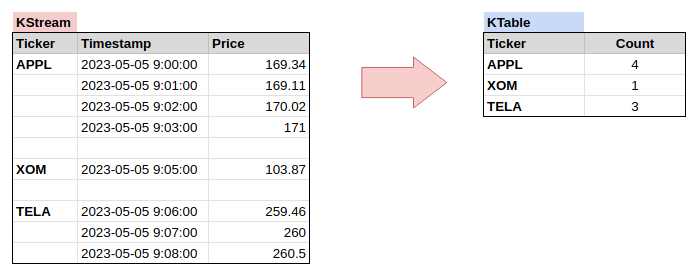
To illustrate the data consolidation, let’s check out this simple example to count number of stock prices by ticker:
Counting the number of messages in a group is a typical example. It converts data streams into a data table which is KTable in Kafka Streams. The diagram below shows you the conversion from KStream to KTable. The message key of KTable is String and value is Long.
While data streams look like a change log that maintains all historical data, KTable keeps only the latest data version.
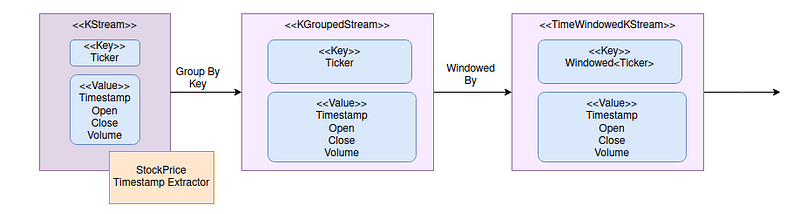
Apply Time Window
The data grouping basically covers all data in the Kafka topic regardless of timestamp. To calculate the moving average of 15-minute intervals, KafKa Streams needs to know the timestamp of the stock prices.
By default, Kafka assigns the current timestamp to a message when it is published to a topic. In our case, we are going to use the timestamp inside the stock price message value. To do so, we build a custom timestamp extractor in order to extract timestamp from messages.
It is pretty simple to build a custom timestamp extractor in Kafka Streams. Just build a class that implements an interface TimestampExtractor and get timestamp from message value and return it in epoch milliseconds in extract() method.
Kafka Streams supports several types of time windows. Sliding window is applicable to the moving average in this example because calculation is event driven instead of fixed time window movement. Refer to official documentation for explanation.
Now, add the custom timestamp extractor to the function call when consuming the input topic using withTimestampExtractor() and bound the data by time window using windowedBy()
We define the sliding windows with an interval of 15 minutes without a grace period. If you would like to cater for any late message, then use the method call with grace period instead.
Messages are split by ticker and time windows. The output now is TimeWindowedKeyStream
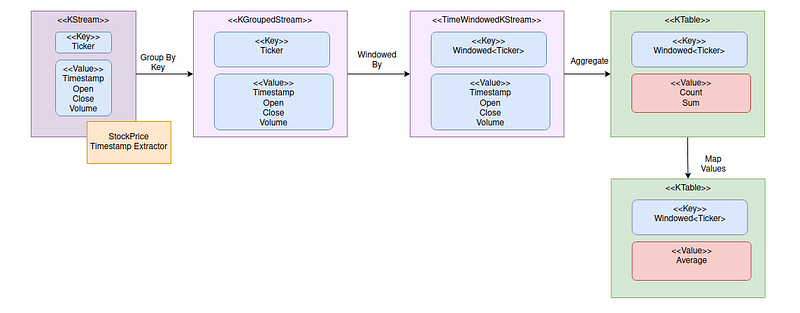
Aggregate Streams of Stock Prices Into Average Values
Calculation of average requires 2 steps:
- Iterate all stock prices within with group (i.e. same ticker and time window) to calculate sum and count
- Convert the total count and sum to average
Grouped Stream offers an operation called aggregate() which iterates each item and performs system logic in a for loop with the following parameters:
- Initial value with zero count and zero sum
- A function that takes the message key and value and also the aggregated data from the previous iteration. The logic returns a new count increment and the updated sum.
The results are stored in a KTable with ticker as the key and CountAndSum DTO as the value.
The second step is to transform the sum and count to average value using mapValues(). The results are stored into another KTable with a windowed key (where WindowedSerdes is provided by Kafka Streams) and average value as the value.
Here is the sample implementation:
Step 1 — use aggregate() to calculate sum and count
Step 2 — use mapValues() to calculate average values
Suppress Data Flow Until Time Window Close
The use of a time window is tricky. Messages are continuously flowing through the pipeline. The same record passes through more than one time window due to the overlap of time windows. Intermediate data is being sent to the output even when time windows are not yet fully completed.
For this use case, we only need the average stock price at 9:15 for the time period of 9:00–9:15. Calculation results of incomplete time windows should be discarded.
Kafka Streams supports this requirement by suppress() operation. Add these lines after mapValues(). It specifies that data flow should be suppressed until the time window is closed.
Convert KTable Back to KStream for Output
KTable only keeps the latest values while the desired output is a data flow of average values as the time window moves forward. In other words, the output is a stream of change logs on the table. Using toStream() is a simple step to convert a table back to data stream
The time windows with residual milliseconds such as [09:00:00.001–09:15:00.001] are produced for some reasons. They should be excluded from the output. Finally, update message key from windowed key to ticker using map()
Verify the Moving Average Topology
Great! The topology is ready, it is time to verify whether it works as expected.
Testing on topology is not possible without running it on automated tests with data feeding the prepared set of testing input data and the expected output.
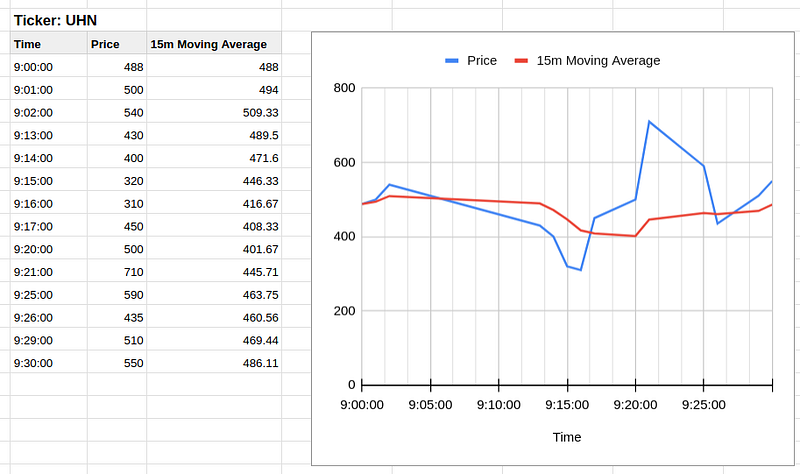
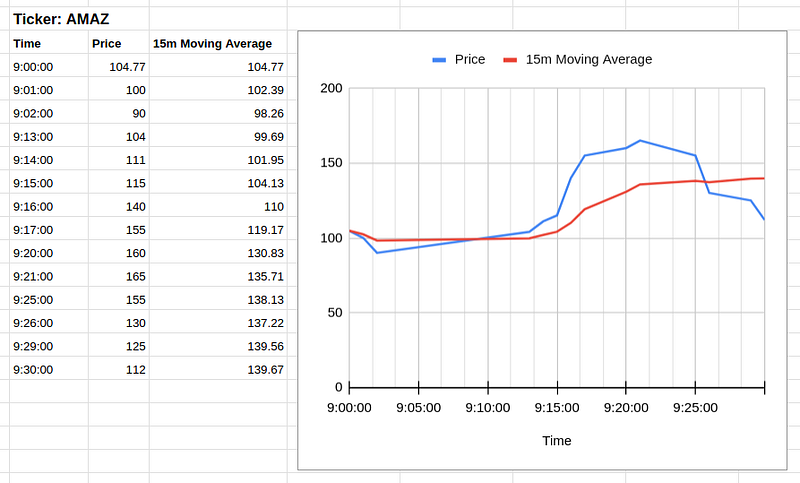
The design of testing data and the expected outputs are the crucial part when it comes to testing. We have the 2 sets of stock prices and the expected moving average for ticker UHN and AMAZ respectively. The stock prices are designed to be fluctuating with time gaps.
The setup relies on TopologyTestDriver, Test Input Topic and Test Output Topic provided by Kafka Streams. The test codes are pretty standard and more or less the same code template can be applied to all other unit tests.
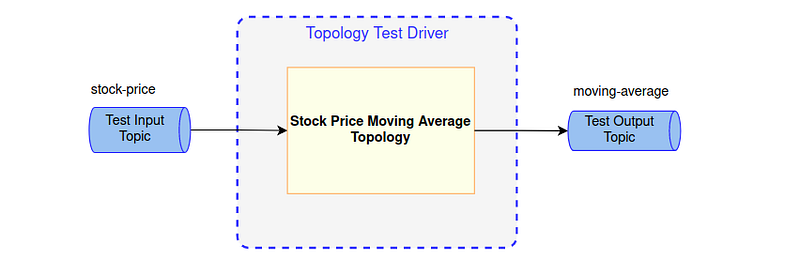
Here is the setup and the tear down methods for each test scenario. Nothing special, just initialize the test driver, topic and the topology. Also, close the test driver at the end of each test.
To run the test, feed stock prices into the input topic and assert the generated moving averages on the output topic
It verifies that the outputs are in the right sequence and moving averages for different tickers are calculated independently.
Final Thoughts
We have gone through the development of the commonly used stick price technical indicator. The formula of average values are simple but the challenge is to do the calculations by time windows for the streams of data.
The concept of stream-table duality, stream data grouping by key and time windows are the useful techniques to implement the real time moving average calculations
In spite of the moving average, there is a number of technical indicators which are essential to stock price analysis. Calculation of those indicators involves complicated calculations and hence more advanced techniques will be adopted in order to implement the real time calculations.
Let’s try another interesting indicator in the next article. Relative Strength Index (RSI) is one of the frequently used indicator which gives traders the buy / sell signals. Calculation of RSI is more complicated and techniques in this article are not sufficient to handle the calculations.
Git Repo
Here is the Git Repo if you are looking for complete source code:


