
Kafka Connect — How to add monitoring with Prometheus and Grafana ?

Monitoring Kafka, Kafka Connect comes with its set of challenges. As organizations increasingly rely on Kafka Connect to move and transform data in real-time, understanding and setup a complete solution become crucial.
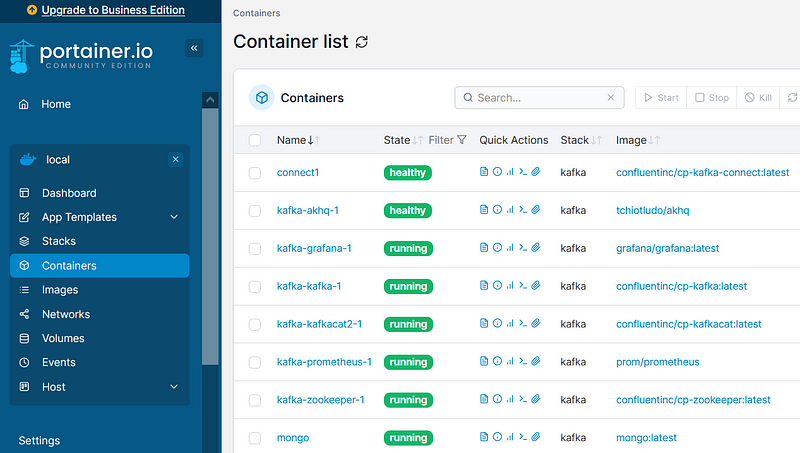
In this post, I will guide you through the process of setting up a monitoring for Kafka Connect using Prometheus and Grafana. First, we setup a Docker Compose file that includes all the necessary services. With a single command, you can create a Kafka , Zookeeper, Kafka Connect , a Kafka UI “akhq”, a schema registry, a kafkacat, a MongoDB, a Prometheus, and a Grafana. My goal is to help you seamlessly create connectors and monitor them.
Prerequisites
- Docker, Docker Compose.
Jmx and Prometheus
What is Prometheus ?
Prometheus is an open-source monitoring tool used to collect, query, and alert on time-series data. It employs a pull-based model to gather metrics from instrumented targets and features a powerful query language (PromQL) for data analysis.
What is JMX Exporter?
JMX Exporter is a Java library used for exposing Java application metrics in a format compatible with monitoring systems like Prometheus. It enables the collection and visualization of key performance metrics, aiding in application monitoring and troubleshooting.
Now, let’s begin:
1- First, add jmx exporter
We need first to download one of the JARs , here we use jmx_prometheus_javaagent-0.18.0.jar . Then we need to add configurations in kafka-connect.yml, and setup jmx java agent with http port 5083 in docker-compose.yml .
KAFKA_OPTS: "-javaagent:/opt/prometheus-jmx-exporter/jmx_prometheus_javaagent-0.18.0.jar=5083:/opt/prometheus-jmx-exporter/kafka-connect.yml"2- Then add configuration to prometheus.yml :
global:
  scrape_interval:     10s # By default, scrape targets every 15 seconds.
  evaluation_interval: 10s # By default, scrape targets every 15 seconds.
  # scrape_timeout is set to the global default (10s).
scrape_configs:
  - job_name: 'prometheus'
    static_configs:
    - targets: ['localhost:9090']
  - job_name: 'kafka-connect'
    scrape_interval: 60s
    scrape_timeout: 30s
    honor_timestamps: true
    static_configs:
      - targets: [ 'connect1:5083' ]
    relabel_configs:
      - source_labels: [ __address__ ]
        target_label: hostname
        regex: '([^:]+)(:[0-9]+)?'
        replacement: '${1}'
Docker-compose
Here is the complete docker compose file:
version: '3.6'
volumes:
  zookeeper-data:
    driver: local
  zookeeper-log:
    driver: local
  kafka-data:
    driver: local
  MONGO_DATA:
    name: MONGO_DATA
  MONGO_CONFIG:
    name: MONGO_CONFIG
services:
  akhq:
    image: tchiotludo/akhq
    restart: unless-stopped
    environment:
      AKHQ_CONFIGURATION: |
        akhq:
          connections:
            docker-kafka-server:
              properties:
                bootstrap.servers: "kafka:9092"
              schema-registry:
                url: "http://schema-registry:8085"
              connect:
                - name: "connect"
                  url: "http://host.docker.internal:8083"
    ports:
      - 8080:8080
    links:
      - kafka
      - schema-registry
  zookeeper:
    image: confluentinc/cp-zookeeper:${CONFLUENT_VERSION:-latest}
    restart: unless-stopped
    volumes:
      - zookeeper-data:/var/lib/zookeeper/data:Z
      - zookeeper-log:/var/lib/zookeeper/log:Z
    environment:
      ZOOKEEPER_CLIENT_PORT: '2181'
      ZOOKEEPER_ADMIN_ENABLE_SERVER: 'false'
  kafka:
    image: confluentinc/cp-kafka:${CONFLUENT_VERSION:-latest}
    restart: unless-stopped
    volumes:
      - kafka-data:/var/lib/kafka/data:Z
    environment:
      KAFKA_BROKER_ID: '0'
      KAFKA_ZOOKEEPER_CONNECT: 'zookeeper:2181'
      KAFKA_NUM_PARTITIONS: '12'
      KAFKA_COMPRESSION_TYPE: 'gzip'
      KAFKA_OFFSETS_TOPIC_REPLICATION_FACTOR: '1'
      KAFKA_TRANSACTION_STATE_LOG_REPLICATION_FACTOR: '1'
      KAFKA_TRANSACTION_STATE_LOG_MIN_ISR: '1'
      KAFKA_ADVERTISED_LISTENERS: 'PLAINTEXT://kafka:9092'
      KAFKA_CONFLUENT_SUPPORT_METRICS_ENABLE: 'false'
      KAFKA_JMX_PORT: '9091'
      KAFKA_AUTO_CREATE_TOPICS_ENABLE: 'true'
      KAFKA_AUTHORIZER_CLASS_NAME: 'kafka.security.authorizer.AclAuthorizer'
      KAFKA_ALLOW_EVERYONE_IF_NO_ACL_FOUND: 'true'
      JMX_PORT: 9999
    links:
      - zookeeper
  connect:
    image: confluentinc/cp-kafka-connect:${CONFLUENT_VERSION:-latest}
    container_name: connect1
    restart: unless-stopped
    ports:
      - 8083:8083
      - 5083:5083
    environment:
      CONNECT_BOOTSTRAP_SERVERS: 'kafka:9092'
      CONNECT_REST_PORT: 8083
      CONNECT_REST_ADVERTISED_HOST_NAME: 'localhost'
      CONNECT_CONFIG_STORAGE_TOPIC: '__connect-config'
      CONNECT_OFFSET_STORAGE_TOPIC: '__connect-offsets'
      CONNECT_STATUS_STORAGE_TOPIC: '__connect-status'
      CONNECT_GROUP_ID: 'kafka-connect'
      CONNECT_KEY_CONVERTER_SCHEMAS_ENABLE: 'true'
      CONNECT_KEY_CONVERTER: 'io.confluent.connect.avro.AvroConverter'
      CONNECT_KEY_CONVERTER_SCHEMA_REGISTRY_URL: 'http://schema-registry:8085'
      CONNECT_VALUE_CONVERTER_SCHEMAS_ENABLE: 'true'
      CONNECT_VALUE_CONVERTER: 'io.confluent.connect.avro.AvroConverter'
      CONNECT_VALUE_CONVERTER_SCHEMA_REGISTRY_URL: 'http://schema-registry:8085'
      CONNECT_INTERNAL_KEY_CONVERTER: 'org.apache.kafka.connect.json.JsonConverter'
      CONNECT_INTERNAL_VALUE_CONVERTER: 'org.apache.kafka.connect.json.JsonConverter'
      CONNECT_OFFSET_STORAGE_REPLICATION_FACTOR: '1'
      CONNECT_CONFIG_STORAGE_REPLICATION_FACTOR: '1'
      CONNECT_STATUS_STORAGE_REPLICATION_FACTOR: '1'
      CONNECT_PLUGIN_PATH: /usr/share/java/,/etc/kafka-connect/jars
      KAFKA_OPTS: "-javaagent:/opt/prometheus-jmx-exporter/jmx_prometheus_javaagent-0.18.0.jar=5083:/opt/prometheus-jmx-exporter/kafka-connect.yml"
      KAFKA_JMX_OPTS: "-Dcom.sun.management.jmxremote=true -Dcom.sun.management.jmxremote.authenticate=false -Dcom.sun.management.jmxremote.ssl=false -Djava.rmi.server.hostname=localhost -Dcom.sun.management.jmxremote.host=localhost -Dcom.sun.management.jmxremote.port=5084 -Dcom.sun.management.jmxremote.rmi.port=5084 -Dcom.sun.management.jmxremote.local.only=false"

    volumes:
      - ./kafka-jars:/etc/kafka-connect/jars
      - ./prometheus:/opt/prometheus-jmx-exporter
  prometheus:
      ports:
        - 9090:9090
      image: prom/prometheus
      command:
        - '--config.file=/etc/prometheus/prometheus.yml'
      volumes:
        - ./prometheus:/etc/prometheus
  grafana:
    image: grafana/grafana:latest
    ports:
      - 3000:3000/tcp
    links:
      - prometheus
    environment:
      GF_INSTALL_PLUGINS: grafana-piechart-panel
    volumes:
      - ./grafana:/etc/grafana/provisioning/

  schema-registry:
    image: confluentinc/cp-schema-registry:${CONFLUENT_VERSION:-latest}
    restart: unless-stopped
    depends_on:
      - kafka
    environment:
      SCHEMA_REGISTRY_KAFKASTORE_BOOTSTRAP_SERVERS: 'PLAINTEXT://kafka:9092'
      SCHEMA_REGISTRY_HOST_NAME: 'schema-registry'
      SCHEMA_REGISTRY_LISTENERS: 'http://0.0.0.0:8085'
      SCHEMA_REGISTRY_LOG4J_ROOT_LOGLEVEL: 'INFO'
  kafkacat:
    image: confluentinc/cp-kafkacat:${CONFLUENT_KAFKACAT_VERSION:-latest}
    restart: unless-stopped
    depends_on:
      - kafka
    command:
      - bash
      - -c
      - |
        kafkacat -P -b kafka:9092 -t json << EOF
        {"_id":"5c4b2b45ab234c86955f0802","index":0,"guid":"d3637b06-9940-4958-9f82-639001c14c34"}
        {"_id":"5c4b2b459ffa9bb0c0c249e1","index":1,"guid":"08612fb5-40a7-45e5-9ff2-beb89a1b2835"}
        {"_id":"5c4b2b4545d7cbc7bf8b6e3e","index":2,"guid":"4880280a-cf8b-4884-881e-7b64ebf2afd0"}
        {"_id":"5c4b2b45dab381e6b3024c6d","index":3,"guid":"36d04c26-0dae-4a8e-a66e-bde9b3b6a745"}
        {"_id":"5c4b2b45d1103ce30dfe1947","index":4,"guid":"14d53f2c-def3-406f-9dfb-c29963fdc37e"}
        {"_id":"5c4b2b45d6d3b5c51d3dacb7","index":5,"guid":"a20cfc3a-934a-4b93-9a03-008ec651b5a4"}
        EOF
    links:
      - kafka
  mongo:
    image: mongo:latest
    container_name: mongo
    environment:
      MONGO_INITDB_ROOT_USERNAME: admin
      MONGO_INITDB_ROOT_PASSWORD: admin
    ports:
      - "0.0.0.0:27017:27017"
    volumes:
      - type: volume
        source: MONGO_DATA
        target: /data/db
      - type: volume
        source: MONGO_CONFIG
        target: /data/configdb
To start all containers:
docker-compose up -d
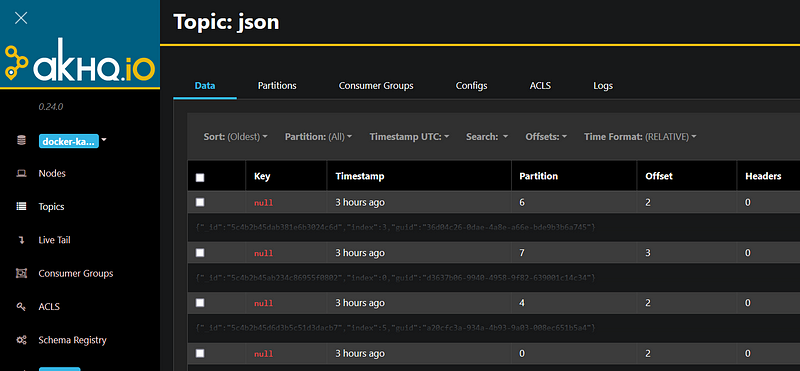
The kafkacat service is here to produce mock json data to a topic named “json”. Let’s go to akhq tool and see the topic:
And if we go to Prometheus :

Create connectors
What are Kafka connectors ?
Kafka connectors are plugins that enable Kafka to integrate with external systems. Connectors are used to ingest data into Kafka topics or export data from Kafka topics to external systems.
Now, let’s create some connectors:
Kafka connect supports a REST API for managing connectors. By default this service runs on port 8083.
To create a connector instance, we PUT or POST a JSON with the connector’s configuration to a REST endpoint on the Connect worker.
Let’s create 2 MongoDB Kafka sink connectors:
curl -X POST -H "Content-Type: application/json" -d '{ "name":"connector-json-1", "config":{"connector.class":"com.mongodb.kafka.connect.MongoSinkConnector","tasks.max":"1","topics":"json","collection":"json1","internal.key.converter.schemas.enable":"false","key.converter.schemas.enable":"false","database":"test","connection.uri":"mongodb://admin:[email protected]:27017","value.converter.schemas.enable":"false","value.converter":"org.apache.kafka.connect.storage.StringConverter"}}' "localhost:8083/connectors"curl -X POST -H "Content-Type: application/json" -d '{ "name":"connector-json-2", "config":{"connector.class":"com.mongodb.kafka.connect.MongoSinkConnector","tasks.max":"1","topics":"json","collection":"json2","internal.key.converter.schemas.enable":"false","key.converter.schemas.enable":"false","database":"test","connection.uri":"mongodb://admin:[email protected]:27017","value.converter.schemas.enable":"false","value.converter":"org.apache.kafka.connect.storage.StringConverter"}}' "localhost:8083/connectors"Each connector will read from the “json” topic and create a collection in mongodb with the messages that were consumed from the topic.
Let’s go to akhq tool to see the connectors:

Monitoring
What is Grafana ?
Grafana is an open-source analytics and monitoring platform used to visualize and analyze data from various sources, including databases, cloud services, and monitoring tools. It offers a flexible and customizable dashboard interface, making it popular for creating visual representations of time-series data and performance metrics.
Now that the prometheus is scraping metrics and grafana is ready to use, we need to go to grafana and create a prometheus datasource:

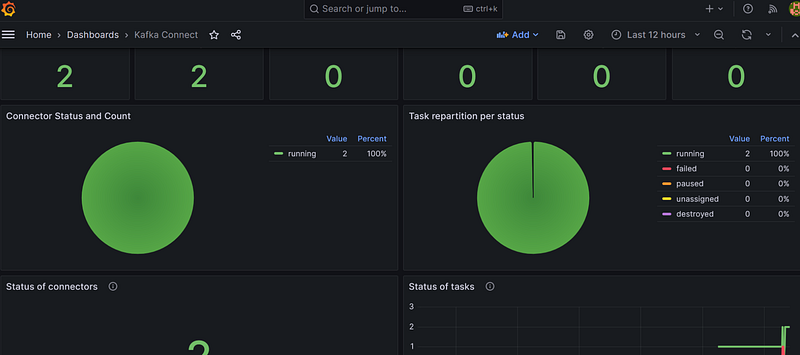
Then, import the json template to create our dashboard, and see the magic happens !

Cleaning up
Remove the running containers:
docker-compose down
References
All the code is available in this GitHub repository.
- https://www.mongodb.com/docs/kafka-connector/current/sink-connector/
- https://github.com/prometheus/jmx_exporter
- https://prometheus.io/
- https://grafana.com/
Conclusion
In this guide, we’ve explored how to set up a monitoring for Kafka Connect using Jmx, Prometheus, and Grafana.
In just a few simple steps, you’ve learned how to:
- Set up the Kafka — Kafka Connect and other usefull services using Docker Compose.
- Configure JMX and Prometheus for collecting metrics.
- Use Grafana to create a monitoring dashboard.
I hope this guide has been valuable in helping you enhance the reliability of your Kafka Connect setup. If you have any questions, feedback, or would like to share your experiences, please feel free to reach out in the comments section. Please click on the Follow and Clap to support me ! ( The more you clap 👏the more I know that you enjoyed it )
Thank you !


