
Jupyter Lab extensions for Data Scientist

Hi! Wanna share my personal top of Jupyter Lab extensions that I used on a daily basis.
If you don’t know what Jupyter is, I highly recommend to try it out! In a few words Jupyter is IDE that works both with Python and R. It have very clean and intuitive interface. And it’s very much suitable for Data Science purposes.
I started to use Jupyter in 2014, back then it was called iPython Notebook. Since then it’s my first choice, if I need to do some exploratory analysis, build visualizations or make a report and share my findings.
Source: https://github.com/jupyterlab/jupyterlab
Installation:
pip install jupyterlab# or if you use conda:conda install -c conda-forge jupyterlab1. JupyterLab LaTeX
When it comes to Data Science it is very critical to be able to pass your finding to all stakeholders, or just simply document your research. LaTex is very useful and flexible tool for that.
Source: https://github.com/jupyterlab/jupyterlab-latex
Installation:
# to install server extension
pip install jupyterlab_latex
# to install jupyter extension
jupyter labextension install @jupyterlab/latexUsage:
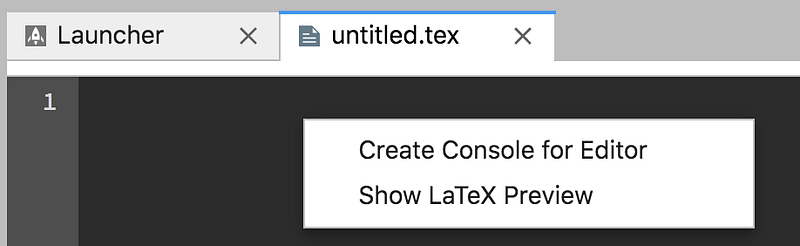
You will need to create text file, change it extension to .tex, then inside this file choose Show LaTeX Preview using mouse right-click
2. JupyterLab HTML
This extension allow you to render HTML file inside of Jupyter Lab, which is can be useful when you need to open for example d3 visualization.
Source: https://github.com/mflevine/jupyterlab_html
Installation:
jupyter labextension install @mflevine/jupyterlab_htmlUsage:
Simply click on html file to open it
3. JupyterLab drawio
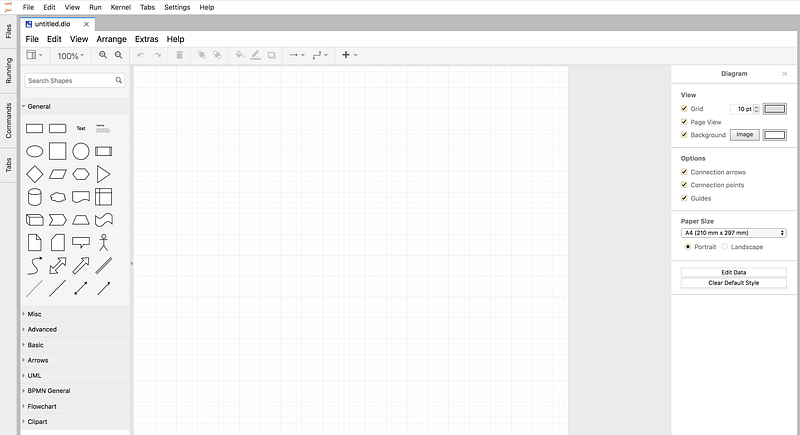
I really love drawio and used to use it from their web-interface, but with this extension it possible to draw schemes directly from jupyter lab.
Source: https://github.com/QuantStack/jupyterlab-drawio
Installation:
jupyter labextension install jupyterlab-drawioUsage:
After installation you will see option to create diagram in your launcher
4. JupyterLab plotly
Plotly is a very cool visualization library that allows to create effective and interactive charts very easily.
Source: https://www.npmjs.com/package/@jupyterlab/plotly-extension
Installation:
jupyter labextension install @jupyterlab/plotly-extensionUsage:
With this extension your plotly visualization will be rendered directly in a notebook.
5. JupyterLab bokeh
Bokeh is another js based library for interactive visualization
Source: https://github.com/bokeh/jupyterlab_bokeh
Installation:
jupyter labextension install jupyterlab_bokehUsage:
Same like with plotly
Conclusion:
In Science in general and particularly in Data Science it is very important to share your findings with other. Jupyter allows us to do it easily. It became more in more popular among scientists from a different fields. It is very cool to see papers with code written in a jupyter notebook, so you can run the code and check results by you own. With same logic Jupyter can help us better manage researches in enterprise, by allowing us to create interactive reports.


