
It’s Time to Set SLA, SLO, SLI for Your Data Team — Only 3 Steps
Key metrics to keep your stakeholders happy

For today’s data teams, the demand for real-time, accurate data has never been higher, but data reliability never gets full attention. Data is growing quickly every day, they come from more sources and formats than ever before. To keep up with it, data teams invest a lot in managing scalable, real-time data infrastructure and building evergrowing dashboards to make smart business decisions. Making correct decisions is challenging and it can only happen with highly reliable data.
Here are a few examples of what reliable data means to the business:
- Deliver accurate and complete data in the expected format to third parties (e.g. regulator, auditor) to meet compliance requirements.
- Whenever the stakeholders want to check data, it’s always available.
- Refresh dashboards before 9 am when the stakeholders look at metrics.
- Bring accurate metrics to the dashboards to help businesses make correct decisions.
- ……
You can’t improve what you don’t measure. As a mature data team, you should start thinking about data reliability from today. It’s not a hot topic in the industry yet, but it brings long-term value to the team as data is becoming the backbone of the organization. This is also a niche that differentiates your team from the rest.
What is data reliability?
Barr Moses, the co-Founder of Monte Carlo, is an advocate for data reliability. She said:
Data reliability is an organization’s ability to deliver high data-availability and health throughout the entire data life cycle. — Barr Moses
From the user stories, you probably get a feel of what data reliability means. We can break it down to several measurable metrics:
- Availability — whether the data is available. Things like network issues or infra issues can prevent users from accessing data.
- Freshness — how up-to-date your data tables are, as well as the rhythm when your tables are updated.
- (In)Completeness — the percentage of unexpected missing data entries, can be both on the row level and column level. For example, is there any row from the upstream tables not being processed? Is there any field in the destination table missing data for > X% of rows?
- Duplicates — the percentage of unexpected duplicated primary key(s).
- Distribution — the accepted range of certain fields. It can be an enumeration or a range of numbers.
- Format — the expected format and schema of the data like CSV, or BigQuery table and the column’s definition.
- Relationship — any test on complicated business logic which involves multiple columns or tables.
I hope that some of the metrics resonate with you. If so, great! Now, let’s turn them into actionable steps.
Introduction of SLA, SLO, SLI
Measurement is the key to achieving high data reliability. The previously mentioned metrics mean nothing if nobody monitors them, and addressing data issues on an ad-hoc basis is not a sustainable way to run the data team.
It feels shameful when stakeholders find obvious data issues before data engineers.
Besides, when stakeholders say “data is wrong”, every data engineer will ask “What do you mean ..?”
SLA, SLO, and SLI are a series of concepts that can help both data engineers and stakeholders understand what is going on with the data and what “wrong data” means exactly. First thing first, here is the definition of each concept. They are very relevant but very different.
SLA (Service Level Agreement) — is a contract that the service provider promises customers on service availability, performance, etc, as well as potential compensation if they fail to deliver. It works for both internal and external data consumers. A few benefits of defining SLA:
- It improves the communication between engineers and stakeholders by clearly defining the scope of data reliability and what “okay” and “not okay” means. Making it crystal clear avoids the needless discussion on what does and doesn’t need attention.
- It helps engineers decide how much time should be spent on delivering features and how much time should be spent on making the existing pipelines more reliable.
- It gives more visibility on how reliable the data is. It’s not fair that only errors get attention, but not when things run smoothly. SLA helps team leaders understand how good their data pipelines (and the team) are and share the success across the organization.
- It gives stakeholders more confidence in the data (and the data team). With the right tool, they can see the real-time status of the SLA for their data without asking repetitively whether the data is healthy. And they know that the issue will be fixed very soon without escalation.
SLA doesn’t only define the scope of data reliability, but also an error budget which is a metric to prevent engineers from burning out and it helps the team allocate the time wisely. For example, from the stakeholder’s point of view, the table should be available and correct all the time, meaning 100% reliability. But it’s not necessary, and not possible either. The business won’t collapse with 0.1% downtime. Rather than striving for 100% reliability, engineers are more willing to deliver new features and do more creative work. The data team should let stakeholders know this fact.
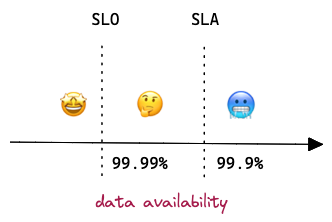
SLO (Service Level Objectives) — is an internal goal that the service provider wants to reach. Usually, it’s similar to SLA but tighter. For example, if data availability threshold is set to 99.9% in SLA, then it should be 99.99% in SLO. If a service breaks SLO, on-call engineers need to react quickly to avoid it breaking SLA, otherwise, the company (or the team) will lose money (or reputation).
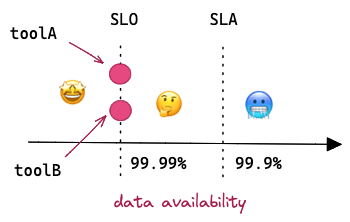
Often, SLO contains more metrics than SLA. For instance, to achieve overall availability 99.9%, the team needs to monitor the up-time of a few internal tools and each of them has its own SLO threshold.
SLI (Service Level Indicators) — is a quantitative measure of some aspects of the service that the service provider uses for reaching SLA goal. It is a specific metric rather than a target. For example, to reach the availability goal, SLIs might be “seconds since the last heartbeat from toolA”. For the freshness goal, SLIs might be “hours since dataset refreshed”. The choice of SLIs is based on the agreement made in SLA.
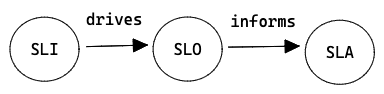
In practice, the SLIs are the metrics in the monitoring system; the SLOs are the alerting rules for on-call engineers and the SLAs are tighter than SLOs and they should keep stakeholders happy.
3 steps to set up SLA / SLO / SLI in your data team
Let’s work with an example. In this example, data engineers and stakeholders define SLA of a critical BigQuery table that contains the company revenue data. Engineers will further down the line define SLIs and SLOs.
Step 1 — Define SLA with your stakeholders
Before step 1, there is a step 0 which is to identify the services that are worth applying SLA to. It could be a key dashboard showing company OKRs or in this example, the most frequently used table within the organization.
Then, define what reliable data means together with your stakeholders. To begin with, data engineers can assess the historical performance of the data to gain a baseline and understand its usage pattern, what fields are mostly queried, and at what frequency. Engineers can ask stakeholders to think about their requirements for reliability. What do they care about the most? Freshness? Accuracy? Availability? Duplicates?
During the discussion with stakeholders, both parties need to agree on realistic numbers to work with. A common pattern is to start at a low SLA and SLO, so engineers don’t need to run 24/7 rotations and stakeholders are ok with a few hours of downtime initially. As the situation gets more stable, you can increase it to the ideal number.
Back to the example, the engineer got a few requirements from the stakeholder:
- Table should be refreshed daily before 9 am with yesterday’s revenue.
- Table should always be accessible.
- Table shouldn’t contain any duplication on the composite key.
- Amount fields like
gross_booking,net_booking,net_revenueshould be calculated correctly.
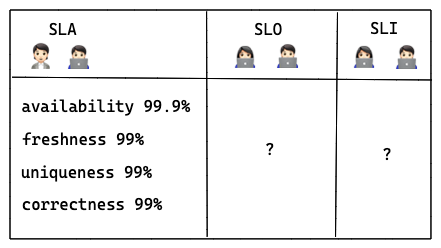
Based on the engineer’s evaluation of the historical performance, they came up with the above SLAs. Availability has a higher SLA because it mostly relies on BigQuery service which promises 99.99% up-time.
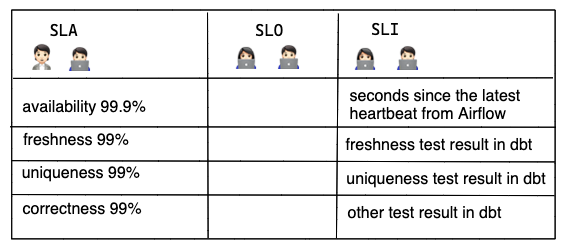
Step 2 — Define SLI to measure reliability
Once you have agreed on SLA, you can start selecting indicators that help you meet SLA. The selection of indicators is very specific to the data infrastructure the team is using. In this example, let’s say the team uses Airflow + BigQuery + dbt to deliver data. So SLI could be:
- Seconds since the latest heartbeat from Airflow (the downtime of Airflow doesn’t have a direct impact on the BigQuery table’s availability, but as mentioned previously, it’s worth monitoring internal tools which contribute to the final SLA).
- Hours since the table was updated last time.
- The test result of the uniqueness test in dbt.
- The test result of other value checking in dbt.
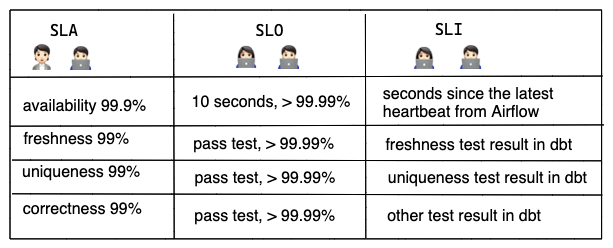
Step 3 — Define SLO and set up alerts
After you’ve defined SLIs, you can set the internally acceptable range of failure per indicator. As mentioned previously, to give on-call engineers enough reaction time, SLO should be more strict than SLA.
Agreeing upon these metrics allows the team to create alerting rules and rates incidents by the level of severity. With the correct monitoring tool, such information can be clearly displayed on the dashboard, making it effective to communicate and resolve the issue.
Define SLOs for services with dependencies
Last, I want to talk about an interesting problem: how to define SLOs for services with dependencies. Any important service has dependencies and each of them may or may not have its own SLOs. How to combine them?
This blog from Google gives a clear answer: Instead of determining your SLO bottom-up (“what can my service achieve based on all of my dependencies?”), go top down: “What SLO do my customers need to be happy?” Use that as your SLO. Once you have an SLO, your dependencies represent sources of risks. If they have higher SLO, then great. Otherwise, you need to mitigate the risk via one of the suggestions in this blog.
If your dependency doesn’t have its own SLO, you can use historical performance instead. If it’s not available either, you have to use your best guess. The blog provides a spreadsheet that models the risks and helps you see how your dependencies affect your service’s SLO performance.
Conclusion
As always, I hope you find this article useful and inspiring. SLA/SLO/SLI (part of SRE) concept was invented by Google and so far, it is mostly applied to Software Engineering teams. But now, as data systems reach similar levels of complexity and importance in the organization, it’s time for the data team to apply the same concepts as well. Implementing SLAs is going to be a cultural change. It takes time and requires collaboration between data engineers and users. But it will make communication way easier and more efficient. The team will benefit from it in the long term. Hope you enjoyed it, Cheers!


