
It’s Okay To Not Have Appropriate Data. Just Create It Yourself.
Two cool ways to create dummy datasets.

Usually, for executing/testing a pipeline, we need to provide it with some dummy data.
However, finding a good dataset can be a challenging task, especially when you need a specific type of data.
Here, looking for open-source datasets can get time-consuming. Moreover, it’s possible that the dataset you find does not fit pretty well into your requirements.
Thus, to clear this mess and help you get straight to the point of testing/training machine learning models, I will share three methods to create dummy datasets in Python.
Let’s begin 🚀!
Why dummy data?
In the context of machine learning, one primary reason you may need dummy data for is testing and evaluation.
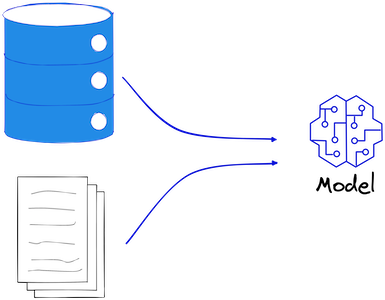
A major advantage here is that it can be created and manipulated at will, without the need for searching real-world data.
This is especially useful when dealing with sensitive or confidential data that cannot be shared or when real data is not available.
Synthetic data lets data professionals maintain a safe environment for testing without compromising the privacy and security of real data.
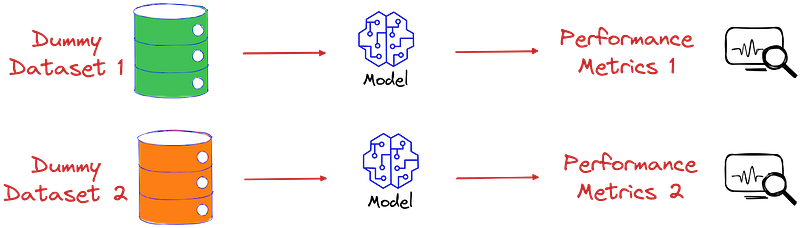
Another significant advantage of using dummy data is that it allows data professionals to test their models in different situations and conditions, and identify potential issues or weaknesses.
Given the immense benefits, let’s look at some popular ways to create dummy datasets in Python. More specifically, we will use Sklearn’s make_classification method.
Also, there’s a cool tool to create dummy dataset towards the end of this blog.
Create dummy datasets with Python
In this section, let’s understand how we can create a classification dataset with the make_classification method.
But just before we do that, it is important to understand some parameters of this method.
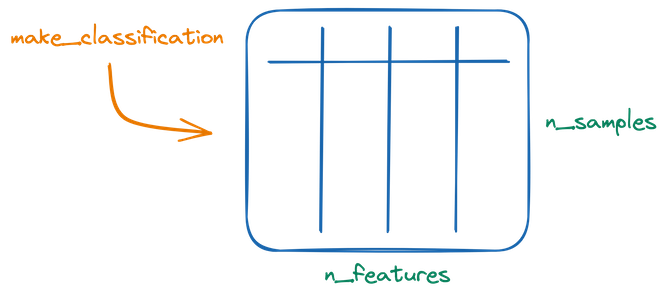
Essentially, the whole idea of make_classification method revolves around creating a numerical dataset, which some specified number of rows (n_samples) and columns (n_features):
The features can be of four types:
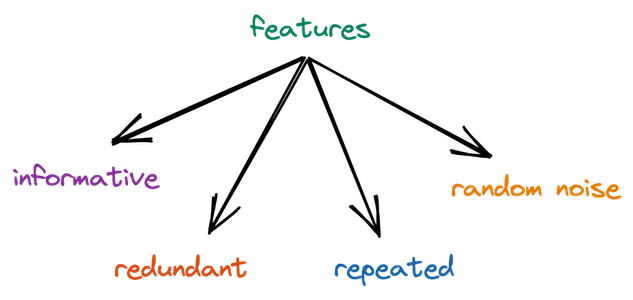
Let’s understand them one by one:
- Informative: Informative features are the features that contribute to the classification decision. The number of informative features can be specified using the
n_informativeparameter. - Redundant: These are linear combinations of the informative features. This is specified using
n_redundantparameter. - Repeated: These are drawn randomly from informative and redundant features. The number of repeated features is specified using
n_repeatedparameters. - Random noise: As the name suggests, these features are just random noise. The number of such features are
=n_features-n_informative-n_redundant-n_repeated.
Lastly, the number of informative, redundant and repeated features must sum to less than the number of total features.
It’s available in the sklearn.datasets module, as imported below:
Next, let’s create a 2-dimensional dataset with 500 samples, with two features — both informative.
Once we visualize this, we get:
That’s how simple it is to create a dummy dataset with this method.
Number of clusters per class
Let’s change the number of clusters per class to two.
Once we visualize it, we see that each class in this data has two individual clusters:
Class imbalance
What if we need an imbalanced dataset?
This is controlled by the weights parameter of the make_classification method.
It is a list depicting the proportions of samples assigned to each class and can be used as follows:
Once we plot this dataset, we can clearly see an imbalanced dataset:
Class separation
In all the above figures, we notice that there is some amount of overlap between the location of data points in both classes.
You can control their separation with the class_sep parameter of the method:
If we plot this data now, we get:
From the visualization, it is pretty evident that now there’s a large gap between the two classes.
Bonus tool
Often when we want data of some specific shape, while programmatically generating it might be feasible, it can also get tedious and time-consuming.
Instead, use drawdata. This allows you to draw any 2D dataset by dragging the mouse in a notebook and export it.
You can install it as follows:
Once installed, open a Jupyter notebook, import the method, and invoke it:
As demonstrated above, you can create a dataset by simply dragging the mouse.
After creating it, click copy csv and use Pandas’ read_clipboard() method to convert it to a DataFrame:
Besides a scatter plot, drawdata can also create histograms and line plots.
Conclusion
With this, we come to the end of this blog.
In this article, we explored how to create synthetic datasets using the make_classification method in scikit-learn.
Additionally, we also looked at how you can create a synthetic 2D dataset in Jupyter by dragging the mouse using drawdata.
Overall, synthetic datasets can be extremely useful for testing and evaluating machine learning models.
The discussed approaches make creating synthetic datasets a pretty straightforward process.
Thanks for reading!
Found this blog interesting?
If you want to learn more such elegant tips and tricks about Data Science and Python, I share an informative tip daily in my newsletter.
You can also find the tips I have posted in My LinkedIn Post Archive. You can follow me on LinkedIn to see all future posts.


