
Is there an estimator in sklearn that prevents overfitting?

When undertaking machine learning, it is important to ensure the data isn’t overfit into the model. Overfitting is a concept in data science that occurs when a statistical model exactly matchesits training data. When the data is overfit, the algorithm cannot perform optimally against unseen data, being the test set.
When an estimator is too complex or trains too long on a dataset, noise or irrelevant information can be introduced into the training set. When the model memorizes the noise and fits too closely to the dataset during the training process, it is said to be overfitted and cannot generalise well with new, unseen data.
When making predictions on data, the data must first be split into two datasets, being training and testing data. The model typically will typically train and fit the training data and make predictions on the test data. If the training dataset has a low error rate and the test dataset has a high error rate, this is indicative of the model being overfit.
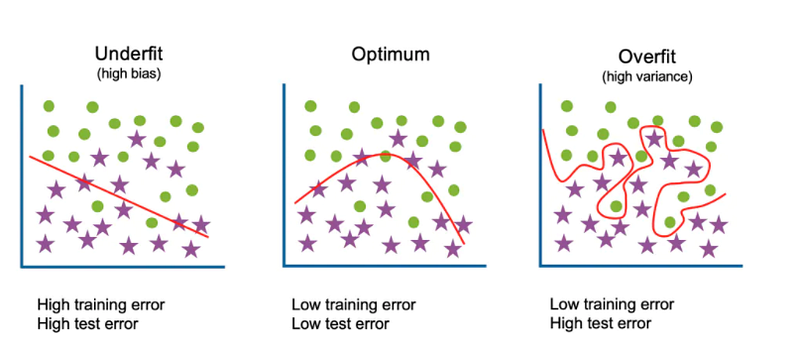
The illustration below shows an example of when the data is underfit, optimally fit, and overfit. When data is underfit, it has a high error rate in both the training and testing datasets. When data is optimally fit, it has a low error on both the training and testing datasets. And finally, when data is overfit, there is a low error rate in the training set and a high error rate in the testing dataset:-
The key therefore is to ensure that data being predicted on is not overfit or underfit. One way to avoid overfitting, therefore, is to choose a model that inherently reduces the capacity to overfit the model.
Ridge regression, which is part of sklearn’s library of estimators, is one estimator that prevents overfitting. This estimator is used to quantify overfitting of data through measuring the magnitude of coefficients. The magnitude of the correlation of the coefficient indicates the strength of an association. In regression, with a single independent variable, the coefficient tells how much the dependent variable is expected to increase or decrease when that independent variable increases by one.
In order to correct the problem of overfitting, it is important to balance how well the model fits data with the magnitude of coefficients. Ridge regression addresses some of the problems of Ordinary Least Squares by imposing a penalty on the size of the coefficients.
Regularisation shrinks the learned estimates towards zero. It tunes the loss function by adding a penalty term that prevents excessive fluctuation of the coefficients, which has the effect of reducing the chances of overfitting.
The parameter that protects against overfitting is alpha in the Ridge regressor estimator. When the alpha parameter is increased, Ridge regressor is pushed to be more robust against overfitting, but this can come at the expense of having a larger training error.
In order to demonstrate how Ridge regressor operates to prevent overfitting, I have decided to try the estimator out on a dataset. I decided to try it out on a dataset, being the automobile dataset that is the focus of Coursera’s Data Analysis course.
The link to the automobile dataset can be found in a Kaggle repository, being here:- https://www.kaggle.com/toramky/automobile-dataset/code?datasetId=1291&sortBy=dateRun&tab=profile
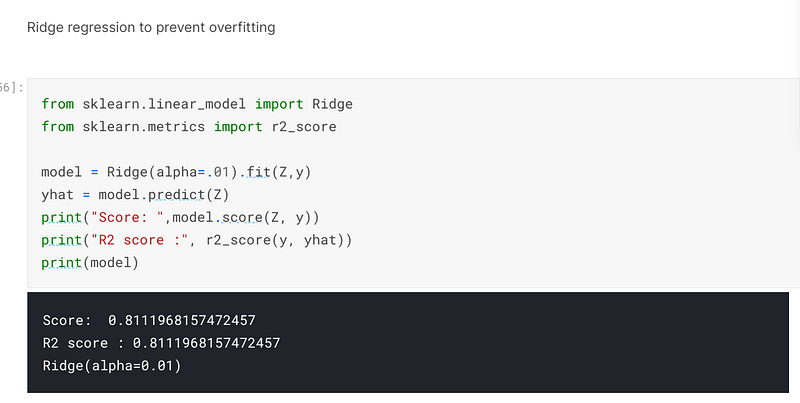
In the screenshot below, I have inserted the code for the Ridge regressor and set the alpha parameter to 0.01. When I trained, fitted and predicted on the model, I had achieved an accuracy of 81.12%:
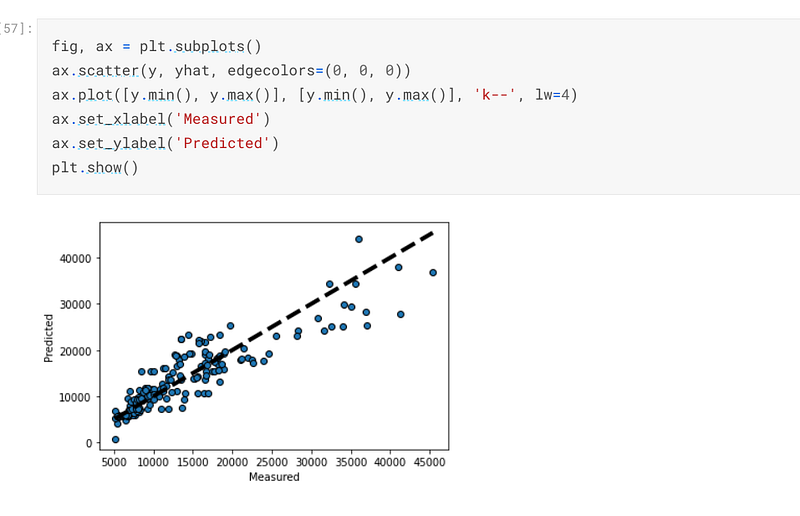
The graph below is a depiction of how the predicted values compare with the actual values:-
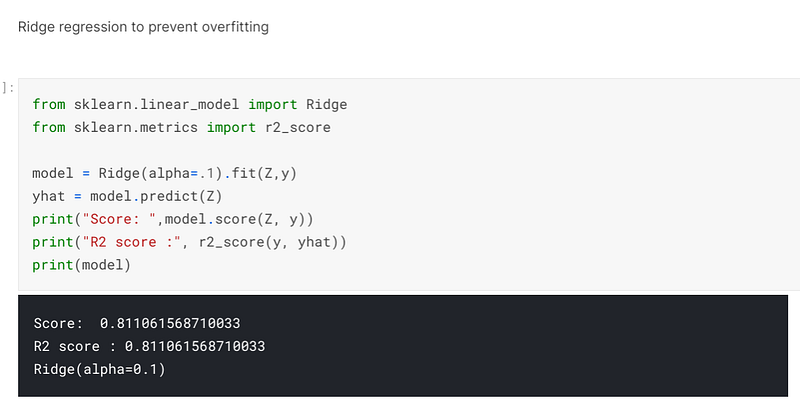
I decided to see what would happen if I increased the alpha to 0.1 and when I trained, fitted and predicted on the data the accuracy had decreased to an accuracy of 81.11%. This reveals that as alpha increased, the propensity of overfitting decreases, but this comes at the expense of a high level of accuracy:-
The graph below is a representation of how the predicted values compare with the actual values, which will be minutely different from the previous graph:-
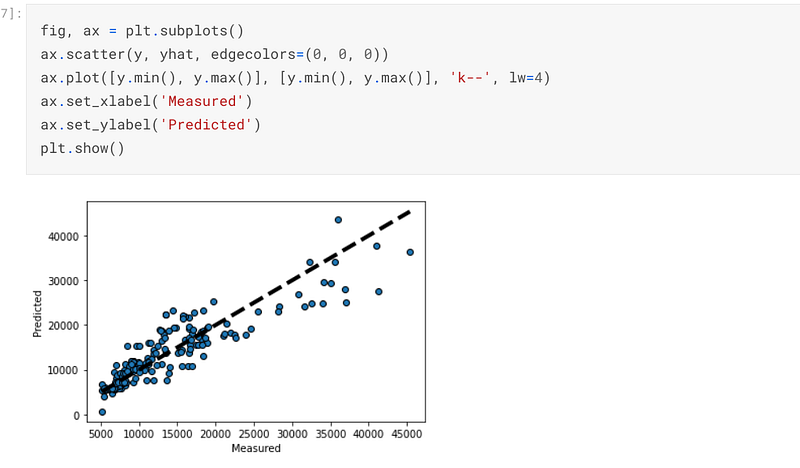
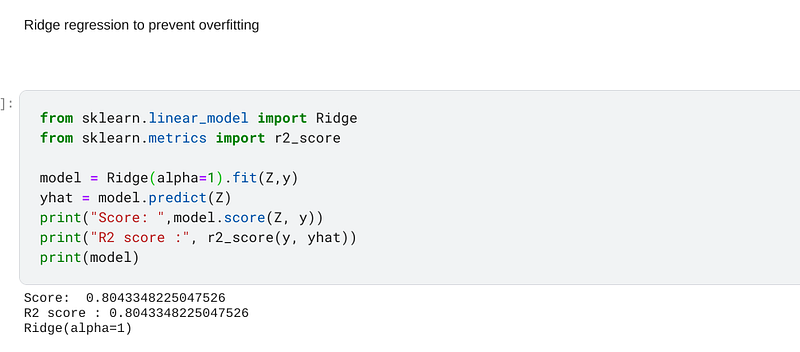
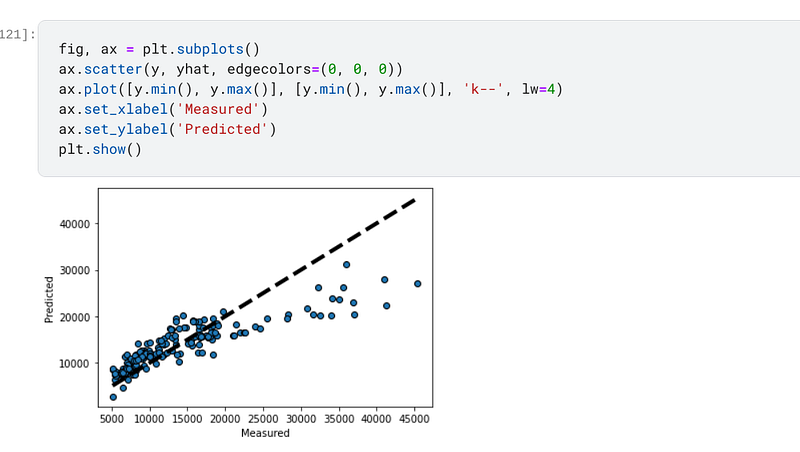
I changed the alpha parameter to 1 and it can be seen that after I trained, fitted and predicted on the model, the accuracy had been decreased to 80.43%. The decrease in accuracy is indicative of the fact that as the alpha increases the robustness of the estimator will increase to prevent overfitting at the expense of accuracy:-
I plotted a graph of the predicted data points compared to the actual data points and there are minute variations in the chart:-
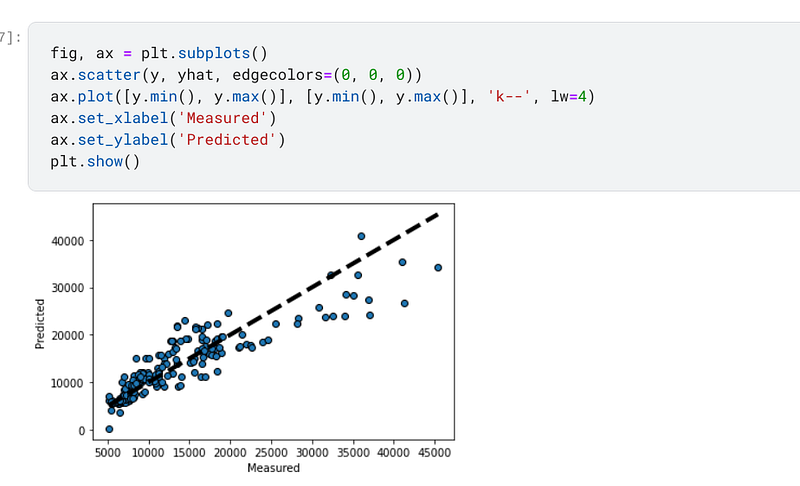
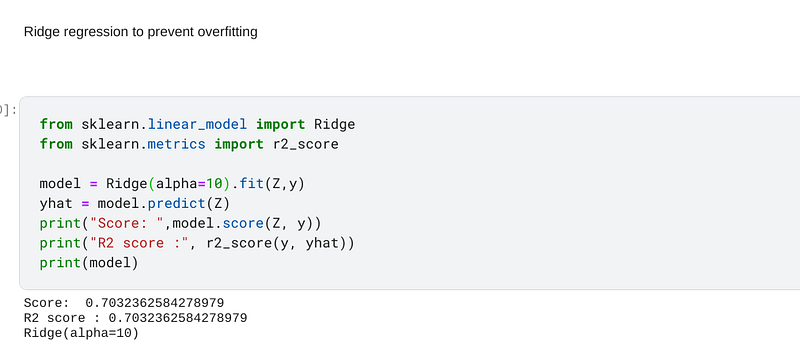
Finally, I increased the alpha in the Ridge regressor to 10 and when I trained, fitted and predicted on the data the accuracy had decreased to 70.32%, which is approximately 8 points lower than the accuracy I achieved when I had set the alpha to 0.01. This is reflective of the fact that the propensity for overfitting had been reduced at the expense of accuracy:-
I also plotted a graph of the predicted values as compared to the actual values, and the change in the value points can be clearly seen at this value of alpha:-
In the last post I have written, I broached the subject of cross validation. The link to that post can be found here:- https://tracyrenee61.medium.com/does-sklearns-cross-val-predict-yield-more-accurate-predictions-than-the-predict-function-5496398fa1d
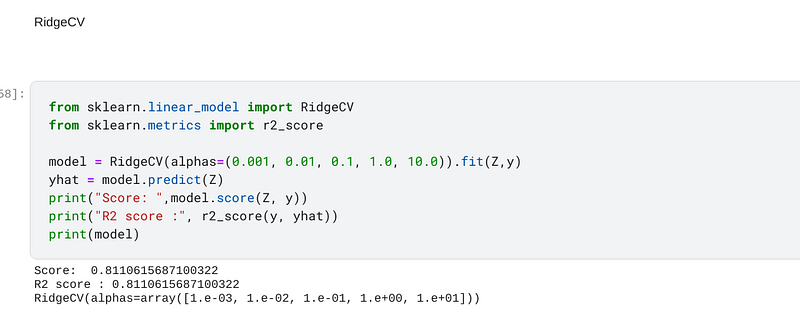
In addition to sklearn having the Ridge regressor in its vast library, it also has RidgeCV, which is simply Ridge regression with cross validation programmed into it. The code for RidgeCV is slightly different to Ridge because there are several values in the alphas parameter. When I trained, fitted and predicted on the data, I achieved an accuracy of 81.11%, which, according to the experiments I have conducted above, indicates that the alpha was selected at 0.1:-
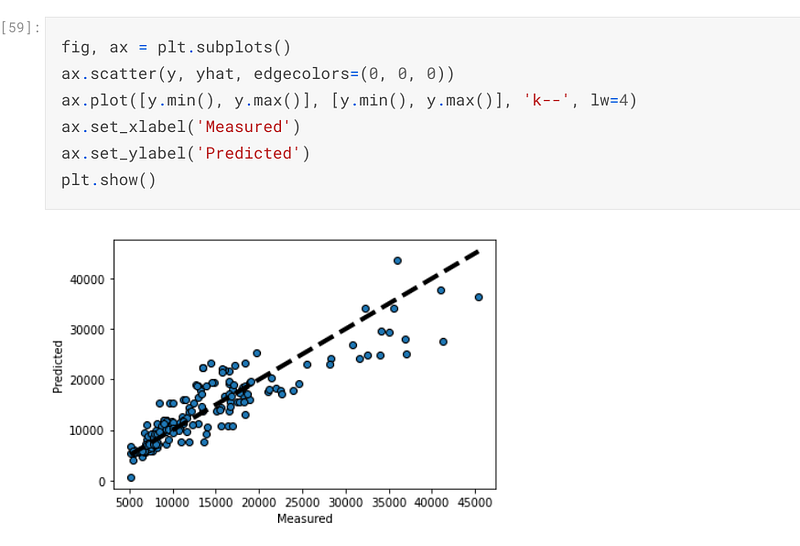
I also plotted a graph of how the predicted variables compare with the actual values and it looks like a graph that has been plotted for low alpha levels:-
In conclusion, it is nice to know that sklearn’s Ridge regressor can be used to reduce overfitting. Sklean also has a facility to perform cross validation for those individuals who do not want to find the optimum alpha by inputting the value of alpha themselves.
The code for this post can be found in its entirety in my personal Kaggle account, the link being here:- https://www.kaggle.com/tracyporter/coursera-data-analysis-with-python?scriptVersionId=74037934